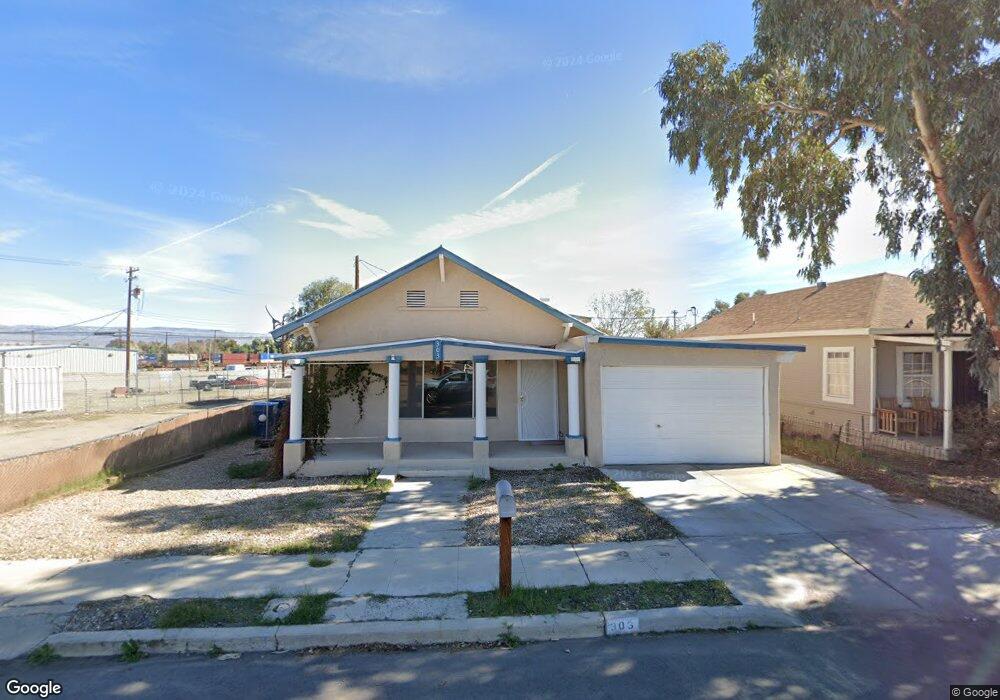
303 C St Needles, CA 92363
Estimated Value: $103,000 - $149,000
1
Bed
1
Bath
834
Sq Ft
$152/Sq Ft
Est. Value
About This Home
This home is located at 303 C St, Needles, CA 92363 and is currently estimated at $126,997, approximately $152 per square foot. 303 C St is a home located in San Bernardino County with nearby schools including Vista Colorado Elementary School, Chemehuevi Valley Elementary School, and Needles Middle School.
Ownership History
Date
Name
Owned For
Owner Type
Purchase Details
Closed on
Jun 30, 2023
Sold by
Morgan Timothy and Morgan Luciana
Bought by
Timothy And Luciana Morgan Living Trust and Morgan
Current Estimated Value
Purchase Details
Closed on
Oct 9, 2006
Sold by
Rose David and Rose Violet
Bought by
Morgan Timothy and Morgan Luciana
Home Financials for this Owner
Home Financials are based on the most recent Mortgage that was taken out on this home.
Original Mortgage
$60,000
Interest Rate
6.36%
Mortgage Type
Purchase Money Mortgage
Purchase Details
Closed on
Aug 4, 2004
Sold by
Shutt Michael Edward
Bought by
Rose David and Rose Violet
Create a Home Valuation Report for This Property
The Home Valuation Report is an in-depth analysis detailing your home's value as well as a comparison with similar homes in the area
Home Values in the Area
Average Home Value in this Area
Purchase History
| Date | Buyer | Sale Price | Title Company |
|---|---|---|---|
| Timothy And Luciana Morgan Living Trust | -- | None Listed On Document | |
| Morgan Timothy | $80,000 | First American Title Ins Age | |
| Rose David | $41,500 | Commonwealth Title |
Source: Public Records
Mortgage History
| Date | Status | Borrower | Loan Amount |
|---|---|---|---|
| Previous Owner | Morgan Timothy | $60,000 |
Source: Public Records
Tax History
| Year | Tax Paid | Tax Assessment Tax Assessment Total Assessment is a certain percentage of the fair market value that is determined by local assessors to be the total taxable value of land and additions on the property. | Land | Improvement |
|---|---|---|---|---|
| 2025 | $1,332 | $107,184 | $17,418 | $89,766 |
| 2024 | $1,310 | $105,082 | $17,076 | $88,006 |
| 2023 | $1,467 | $103,021 | $16,741 | $86,280 |
| 2022 | $1,298 | $90,000 | $22,000 | $68,000 |
| 2021 | $850 | $54,000 | $15,000 | $39,000 |
| 2020 | $797 | $49,800 | $12,700 | $37,100 |
| 2019 | $777 | $47,000 | $12,000 | $35,000 |
| 2018 | $736 | $43,100 | $10,800 | $32,300 |
| 2017 | $686 | $40,000 | $10,000 | $30,000 |
| 2016 | $635 | $40,000 | $10,000 | $30,000 |
| 2015 | $527 | $40,000 | $10,000 | $30,000 |
| 2014 | $485 | $40,000 | $10,000 | $30,000 |
Source: Public Records
Map
Nearby Homes
Your Personal Tour Guide
Ask me questions while you tour the home.