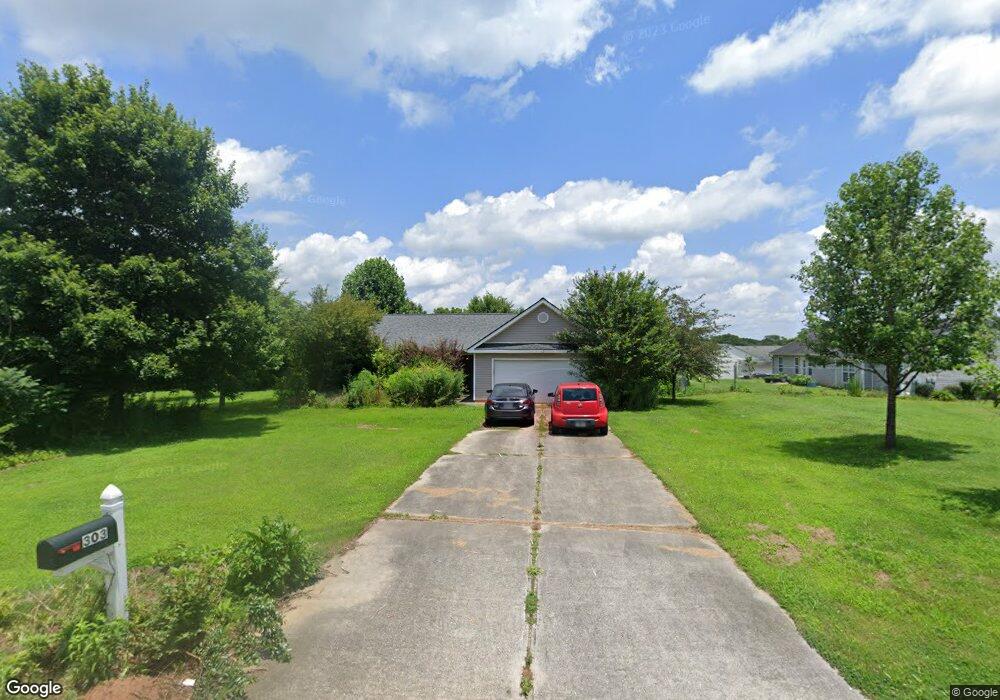
303 Clearbrooke Way Unit Lot 13 Winder, GA 30680
Estimated Value: $305,000 - $321,000
3
Beds
2
Baths
1,190
Sq Ft
$260/Sq Ft
Est. Value
About This Home
This home is located at 303 Clearbrooke Way Unit Lot 13, Winder, GA 30680 and is currently estimated at $309,343, approximately $259 per square foot. 303 Clearbrooke Way Unit Lot 13 is a home located in Barrow County with nearby schools including Statham Elementary School, Bear Creek Middle School, and Winder-Barrow High School.
Ownership History
Date
Name
Owned For
Owner Type
Purchase Details
Closed on
May 16, 2019
Sold by
Weathers Mary Elizabeth
Bought by
Oneill William and Rudowske Emily
Current Estimated Value
Home Financials for this Owner
Home Financials are based on the most recent Mortgage that was taken out on this home.
Original Mortgage
$174,747
Outstanding Balance
$153,326
Interest Rate
4.1%
Mortgage Type
New Conventional
Estimated Equity
$156,017
Purchase Details
Closed on
Oct 25, 2018
Sold by
Myers Monica A
Bought by
Weathers Mary Elizabeth
Purchase Details
Closed on
Apr 21, 2006
Sold by
Star Hm Builders Inc
Bought by
Myers Monica A
Home Financials for this Owner
Home Financials are based on the most recent Mortgage that was taken out on this home.
Original Mortgage
$121,000
Interest Rate
6.31%
Mortgage Type
New Conventional
Purchase Details
Closed on
Oct 15, 2004
Sold by
Pwl Co Inc
Bought by
Star Home Builders Inc
Purchase Details
Closed on
Sep 10, 2003
Bought by
Pwl Co Inc
Create a Home Valuation Report for This Property
The Home Valuation Report is an in-depth analysis detailing your home's value as well as a comparison with similar homes in the area
Home Values in the Area
Average Home Value in this Area
Purchase History
| Date | Buyer | Sale Price | Title Company |
|---|---|---|---|
| Oneill William | $173,000 | -- | |
| Weathers Mary Elizabeth | $166,000 | -- | |
| Myers Monica A | $121,000 | -- | |
| Star Home Builders Inc | $36,000 | -- | |
| Pwl Co Inc | -- | -- |
Source: Public Records
Mortgage History
| Date | Status | Borrower | Loan Amount |
|---|---|---|---|
| Open | Oneill William | $174,747 | |
| Previous Owner | Myers Monica A | $121,000 |
Source: Public Records
Tax History Compared to Growth
Tax History
| Year | Tax Paid | Tax Assessment Tax Assessment Total Assessment is a certain percentage of the fair market value that is determined by local assessors to be the total taxable value of land and additions on the property. | Land | Improvement |
|---|---|---|---|---|
| 2024 | $2,488 | $97,086 | $21,600 | $75,486 |
| 2023 | $2,493 | $97,486 | $21,600 | $75,886 |
| 2022 | $1,963 | $65,207 | $16,000 | $49,207 |
| 2021 | $2,070 | $65,207 | $16,000 | $49,207 |
| 2020 | $2,073 | $65,207 | $16,000 | $49,207 |
| 2019 | $679 | $61,692 | $16,000 | $45,692 |
| 2018 | $1,639 | $50,420 | $10,600 | $39,820 |
| 2017 | $1,097 | $37,690 | $10,600 | $27,090 |
| 2016 | $1,172 | $35,534 | $10,600 | $24,934 |
| 2015 | $1,185 | $35,803 | $10,600 | $25,203 |
| 2014 | $1,133 | $32,921 | $7,448 | $25,473 |
| 2013 | -- | $31,667 | $7,448 | $24,219 |
Source: Public Records
Map
Nearby Homes
- 1212 Highway 211 NE
- 1226 Highway 211 NE
- 1206 Corkybrooke Ln
- 917 Justin Dr Unit 3
- 330 Anchors Way
- 1553 Shoal Creek Dr
- 388 Kay Dr Unit 1
- 1556 Shoal Creek Dr
- 212 Rainbow Ln
- 385 Finch Landing Rd
- 1431 Solomon Dr
- 508 Pleasant Hill Church Rd NE
- 1023 Solomon Ct
- 1453 Solomon Dr
- 130 (Tract 1) Bowman Mill Rd NE
- 130 Bowman Mill Rd NE Unit 1
- 0 Hancock Bridge Rd Unit 10535063
- 867 Windward Rd
- 315 Paige Way
- 63 Delightful Way Unit 1
- 303 Clearbrooke Way
- 305 Clearbrooke Way Unit Lot 14
- 305 Clearbrooke Way
- 1219 Clearwater Dr Unit Lot 12
- 1219 Clearwater Dr
- 1217 Clearwater Dr Unit Lot 11
- 1217 Clearwater Dr
- 1225 Clearwater Dr Unit Lot 18
- 1225 Clearwater Dr
- 0 Clearwater Dr Unit 7118761
- 0 Clearwater Dr Unit 7099260
- 0 Clearwater Dr Unit 8380448
- 0 Clearwater Dr Unit 8833129
- 1215 Clearwater Dr Unit Lot 10
- 1215 Clearwater Dr
- 304 Clearbrooke Way Unit Lot 17
- 304 Clearbrooke Way
- 306 Clearbrooke Way Unit Lot 16
- 306 Clearbrooke Way
- 308 Clearbrooke Way Unit Lot 15