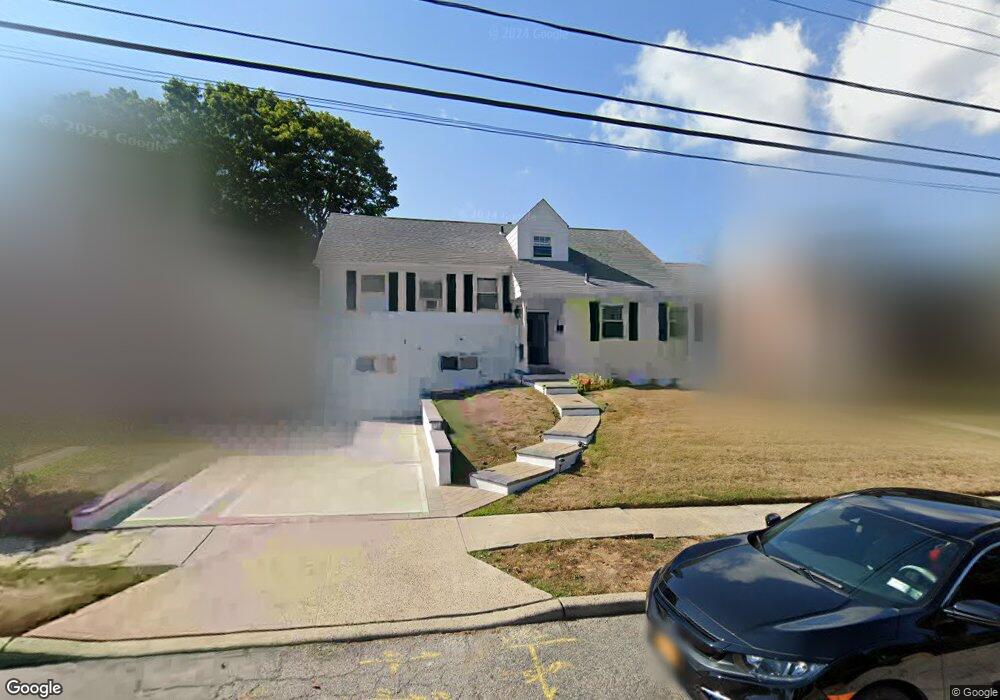
303 Colonial Rd West Hempstead, NY 11552
Estimated Value: $679,000 - $737,042
--
Bed
1
Bath
1,464
Sq Ft
$484/Sq Ft
Est. Value
About This Home
This home is located at 303 Colonial Rd, West Hempstead, NY 11552 and is currently estimated at $708,021, approximately $483 per square foot. 303 Colonial Rd is a home located in Nassau County with nearby schools including Davison Avenue Intermediate School, Maurice W. Downing Primary K-2 School, and Howard T Herber Middle School.
Ownership History
Date
Name
Owned For
Owner Type
Purchase Details
Closed on
Mar 26, 2021
Sold by
Hill Denisha A
Bought by
Hill Denisha A
Current Estimated Value
Purchase Details
Closed on
Jan 27, 2006
Sold by
Bush Martin
Bought by
Hill Michael
Purchase Details
Closed on
Aug 6, 2004
Sold by
Jaa Housing Inc
Bought by
Bush Martin
Purchase Details
Closed on
Sep 30, 2003
Sold by
Danismine Corp
Bought by
Jaa Housing Inc
Purchase Details
Closed on
Sep 15, 2003
Sold by
Martin Joseph
Bought by
Danismine Corp
Purchase Details
Closed on
Dec 21, 1995
Sold by
Richardson Wyteria and Richardson Burnette
Bought by
Martin Joseph and Martin Angela
Home Financials for this Owner
Home Financials are based on the most recent Mortgage that was taken out on this home.
Original Mortgage
$148,200
Interest Rate
7.34%
Create a Home Valuation Report for This Property
The Home Valuation Report is an in-depth analysis detailing your home's value as well as a comparison with similar homes in the area
Home Values in the Area
Average Home Value in this Area
Purchase History
| Date | Buyer | Sale Price | Title Company |
|---|---|---|---|
| Hill Denisha A | -- | None Available | |
| Hill Michael | $450,000 | -- | |
| Bush Martin | $350,000 | -- | |
| Jaa Housing Inc | $190,000 | -- | |
| Danismine Corp | $180,000 | -- | |
| Martin Joseph | $156,000 | -- |
Source: Public Records
Mortgage History
| Date | Status | Borrower | Loan Amount |
|---|---|---|---|
| Previous Owner | Martin Joseph | $148,200 |
Source: Public Records
Tax History Compared to Growth
Tax History
| Year | Tax Paid | Tax Assessment Tax Assessment Total Assessment is a certain percentage of the fair market value that is determined by local assessors to be the total taxable value of land and additions on the property. | Land | Improvement |
|---|---|---|---|---|
| 2025 | $12,937 | $433 | $161 | $272 |
| 2024 | $4,509 | $433 | $161 | $272 |
| 2023 | $13,349 | $433 | $161 | $272 |
| 2022 | $13,349 | $432 | $161 | $271 |
| 2021 | $16,676 | $408 | $152 | $256 |
| 2020 | $13,402 | $784 | $424 | $360 |
| 2019 | $5,072 | $784 | $424 | $360 |
| 2018 | $4,804 | $784 | $0 | $0 |
| 2017 | $7,308 | $784 | $424 | $360 |
| 2016 | $11,919 | $784 | $424 | $360 |
| 2015 | $4,315 | $784 | $424 | $360 |
| 2014 | $4,315 | $784 | $424 | $360 |
| 2013 | $4,204 | $784 | $424 | $360 |
Source: Public Records
Map
Nearby Homes
- 5 Juliette Rd
- 394 Pinebrook Ave
- 49 Carol St
- 312 Coventry Rd S
- 10 Pinebrook Ave
- 301 Coventry Rd N
- 1024 Mahopac Rd
- 1070 Mahopac Rd
- 461 Pinebrook Ave
- 55 Melvin Ave
- 486 Champlain Ave
- 7 Hopatcong Ave
- 841 Woodfield Rd
- 1095 Pinebrook Ct
- 1090 Pinebrook Ct
- 402 Clinton Ave
- 450 Rhodes Ln
- 0 Rhodes Ln
- 362 Langdon Blvd
- 1025 Ontario Rd