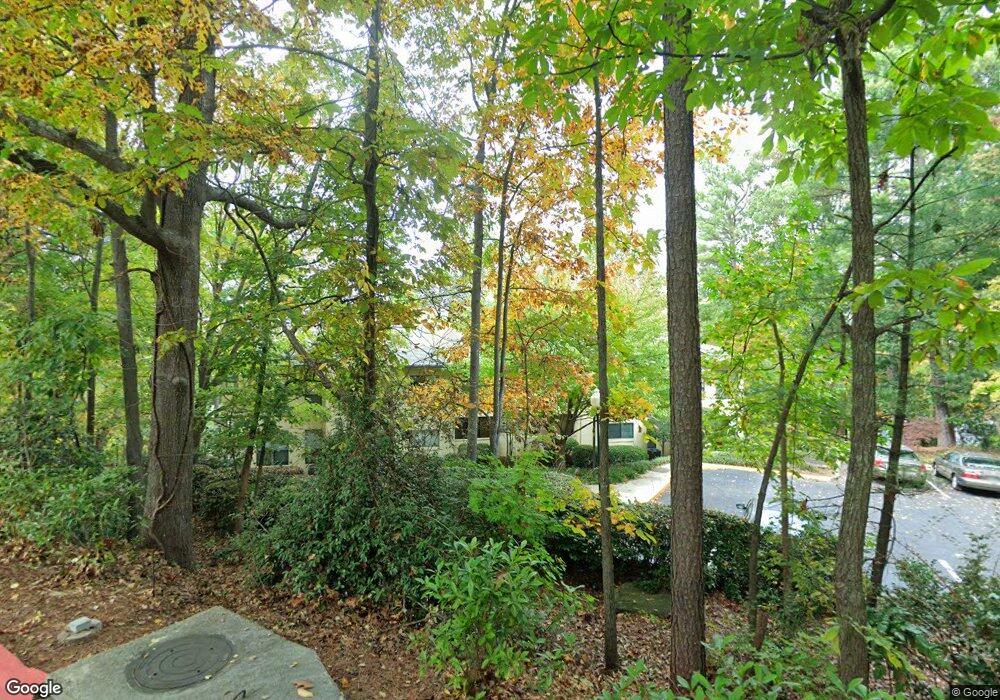
303 Comeragh SE Unit 303 Smyrna, GA 30080
Vinings NeighborhoodEstimated Value: $253,000 - $262,588
2
Beds
2
Baths
1,381
Sq Ft
$187/Sq Ft
Est. Value
About This Home
This home is located at 303 Comeragh SE Unit 303, Smyrna, GA 30080 and is currently estimated at $257,647, approximately $186 per square foot. 303 Comeragh SE Unit 303 is a home located in Cobb County with nearby schools including Brumby Elementary School, East Cobb Middle School, and Wheeler High School.
Ownership History
Date
Name
Owned For
Owner Type
Purchase Details
Closed on
Mar 30, 2021
Sold by
Lowman Jo Lynne
Bought by
Celtic Holding International Corp
Current Estimated Value
Purchase Details
Closed on
Oct 9, 2001
Sold by
Sibbitt Eva M
Bought by
Lowman Jo L
Home Financials for this Owner
Home Financials are based on the most recent Mortgage that was taken out on this home.
Original Mortgage
$100,800
Interest Rate
6.85%
Mortgage Type
New Conventional
Purchase Details
Closed on
May 13, 1999
Sold by
Slaughter Nancy L
Bought by
Motley Eva R
Home Financials for this Owner
Home Financials are based on the most recent Mortgage that was taken out on this home.
Original Mortgage
$90,100
Interest Rate
6.98%
Mortgage Type
New Conventional
Purchase Details
Closed on
Nov 27, 1996
Sold by
Lee D K
Bought by
Slaughter Nancy L
Create a Home Valuation Report for This Property
The Home Valuation Report is an in-depth analysis detailing your home's value as well as a comparison with similar homes in the area
Home Values in the Area
Average Home Value in this Area
Purchase History
| Date | Buyer | Sale Price | Title Company |
|---|---|---|---|
| Celtic Holding International Corp | -- | None Listed On Document | |
| Lowman Jo L | $126,000 | -- | |
| Motley Eva R | $106,000 | -- | |
| Slaughter Nancy L | $81,000 | -- |
Source: Public Records
Mortgage History
| Date | Status | Borrower | Loan Amount |
|---|---|---|---|
| Previous Owner | Lowman Jo L | $100,800 | |
| Previous Owner | Motley Eva R | $90,100 | |
| Closed | Slaughter Nancy L | $0 |
Source: Public Records
Tax History Compared to Growth
Tax History
| Year | Tax Paid | Tax Assessment Tax Assessment Total Assessment is a certain percentage of the fair market value that is determined by local assessors to be the total taxable value of land and additions on the property. | Land | Improvement |
|---|---|---|---|---|
| 2024 | $3,333 | $110,544 | $34,000 | $76,544 |
| 2023 | $3,014 | $99,972 | $34,000 | $65,972 |
| 2022 | $483 | $87,296 | $18,000 | $69,296 |
| 2021 | $439 | $72,516 | $18,000 | $54,516 |
| 2020 | $439 | $72,516 | $18,000 | $54,516 |
| 2019 | $422 | $66,916 | $18,000 | $48,916 |
| 2018 | $391 | $56,644 | $18,000 | $38,644 |
| 2017 | $331 | $49,604 | $12,800 | $36,804 |
| 2016 | $313 | $43,296 | $11,200 | $32,096 |
| 2015 | $317 | $37,956 | $8,000 | $29,956 |
| 2014 | $151 | $20,796 | $0 | $0 |
Source: Public Records
Map
Nearby Homes
- 1010 Donegal SE
- 2382 Crescent Park Ct Unit 421
- 2380 Crescent Park Ct Unit 4
- 2428 Crescent Park Ct
- 2442 Crescent Park Ct
- 2560 Crescent Park Ct
- 2801 Avington Ln SE
- 2790 Avington Ln SE
- 2548 Crescent Park Ct Unit 742
- 2548 Crescent Park Ct Unit 7
- 2256 Royal Vineyard Ln SE
- 1222 Ridgecrest Ln SE
- 5136 Afton Way SE
- 1305 Ridgecrest Ln SE
- 2341 Brenda Dr SE
- 1350 Overlook Cove SE
- 1013 Rohner Way
- 1024 Rohner Way
- 305 Comeragh SE Unit 5
- 309 Comeragh SE
- 306 Comeragh SE
- 305 Comeragh SE Unit 305
- 304 Comeragh SE Unit 4
- 307 Comeragh SE
- 304 Comeragh SE
- 308 Comeragh SE
- 302 Comeragh SE
- 301 Comeragh SE
- 0 Lismore SE Unit 3217867
- 0 Lismore SE Unit 8474927
- 0 Lismore SE Unit 7384666
- 0 Lismore SE Unit 7136335
- 0 Lismore SE Unit 7122291
- 0 Lismore SE Unit 3116956
- 0 Lismore SE Unit 8666839
- 0 Lismore SE Unit 8585489
- 0 Lismore SE Unit 8547407
- 0 Lismore SE Unit 8176522