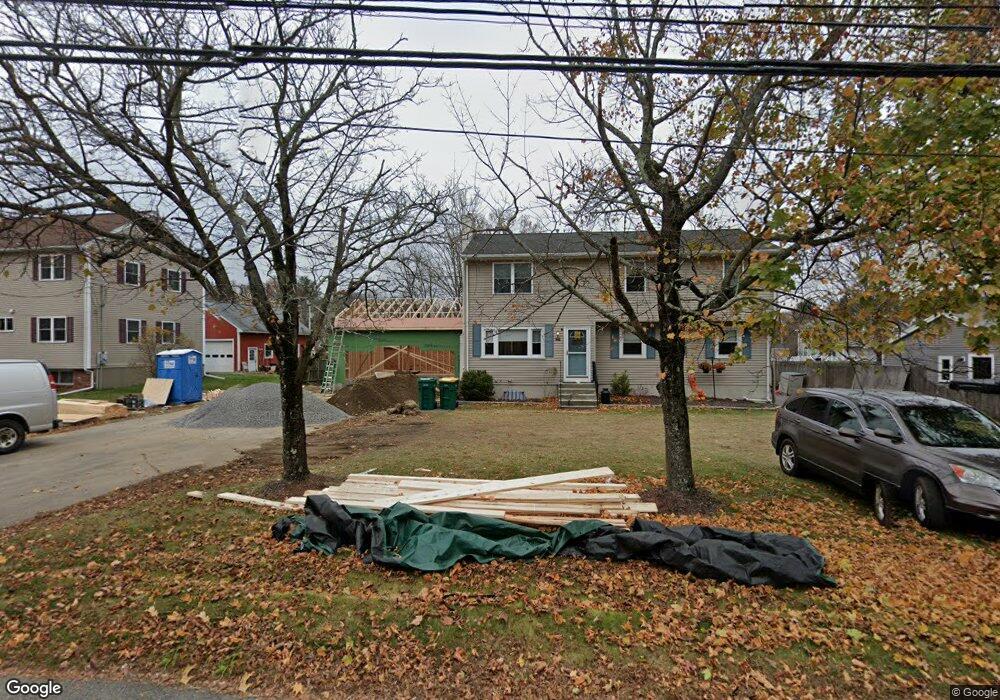
303 Cox St Hudson, MA 01749
Estimated Value: $643,013 - $701,000
4
Beds
3
Baths
2,136
Sq Ft
$311/Sq Ft
Est. Value
About This Home
This home is located at 303 Cox St, Hudson, MA 01749 and is currently estimated at $663,753, approximately $310 per square foot. 303 Cox St is a home located in Middlesex County with nearby schools including David J. Quinn Middle School, Hudson High School, and First Steps Children's Center.
Ownership History
Date
Name
Owned For
Owner Type
Purchase Details
Closed on
Mar 1, 1995
Sold by
Moisan Karl and Moisan Susan P
Bought by
Ogar John W and Ogar Kristen E
Current Estimated Value
Home Financials for this Owner
Home Financials are based on the most recent Mortgage that was taken out on this home.
Original Mortgage
$109,000
Interest Rate
8.96%
Mortgage Type
Purchase Money Mortgage
Create a Home Valuation Report for This Property
The Home Valuation Report is an in-depth analysis detailing your home's value as well as a comparison with similar homes in the area
Home Values in the Area
Average Home Value in this Area
Purchase History
| Date | Buyer | Sale Price | Title Company |
|---|---|---|---|
| Ogar John W | $115,000 | -- |
Source: Public Records
Mortgage History
| Date | Status | Borrower | Loan Amount |
|---|---|---|---|
| Closed | Ogar John W | $109,000 | |
| Previous Owner | Ogar John W | $92,000 | |
| Previous Owner | Ogar John W | $10,000 |
Source: Public Records
Tax History
| Year | Tax Paid | Tax Assessment Tax Assessment Total Assessment is a certain percentage of the fair market value that is determined by local assessors to be the total taxable value of land and additions on the property. | Land | Improvement |
|---|---|---|---|---|
| 2025 | $7,839 | $564,800 | $184,000 | $380,800 |
| 2024 | $7,654 | $546,700 | $167,200 | $379,500 |
| 2023 | $6,919 | $473,900 | $160,800 | $313,100 |
| 2022 | $6,712 | $423,200 | $146,200 | $277,000 |
| 2021 | $4,456 | $384,900 | $139,200 | $245,700 |
| 2020 | $6,242 | $375,800 | $136,600 | $239,200 |
| 2019 | $7,421 | $347,300 | $136,600 | $210,700 |
| 2018 | $5,763 | $329,300 | $130,000 | $199,300 |
| 2017 | $5,490 | $313,700 | $123,800 | $189,900 |
| 2016 | $5,128 | $296,600 | $123,800 | $172,800 |
| 2015 | $4,929 | $285,400 | $123,800 | $161,600 |
| 2014 | $4,702 | $269,900 | $108,500 | $161,400 |
Source: Public Records
Map
Nearby Homes
- 304 Cox St
- 425 Main St Unit 7C
- 425 Main St Unit 21D
- 1 Glendale Rd
- 28 Pierce St
- 26 Marychris Dr
- 7 Old North Rd
- 12 Old County Rd Unit 20
- 37 Tower St
- 26 Old Bolton Rd
- 34 Forest Ave
- 11 Barracks Rd Unit 11
- 32 Barracks Rd Unit 32
- 12 Barracks Rd Unit 12
- 7 Barracks Rd Unit 7
- 5 Barracks Rd Unit 5
- 13 Barracks Rd Unit 13
- 10 Barracks Rd Unit 10
- 128 Manning St
- 16 Barnes Blvd Unit 16
Your Personal Tour Guide
Ask me questions while you tour the home.