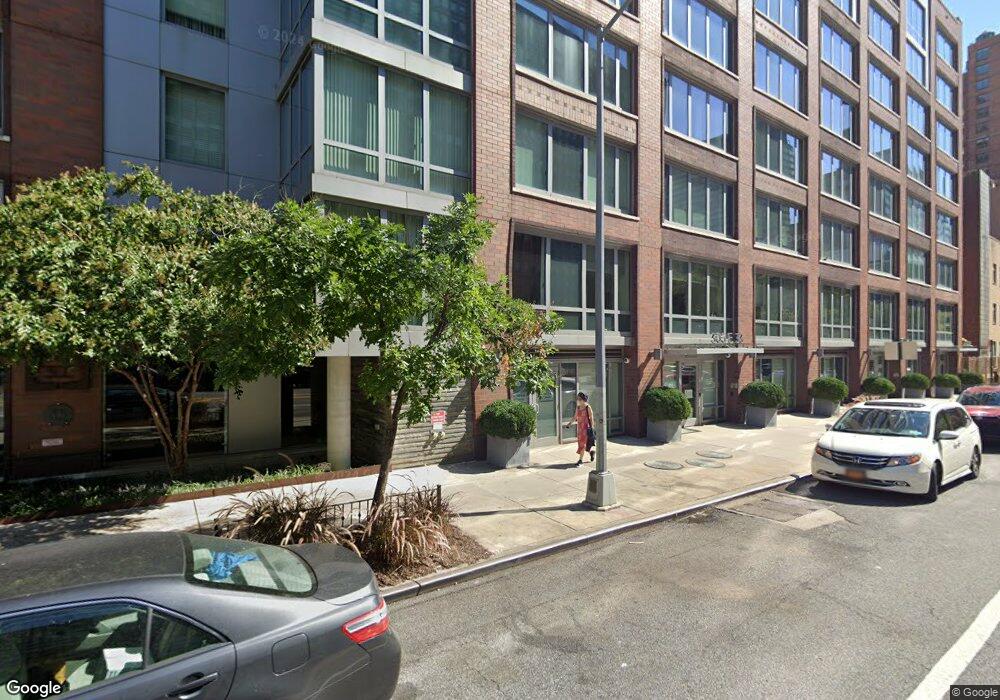
303 Residences 303 E 33rd St Unit 2A New York, NY 10016
Kips Bay NeighborhoodEstimated Value: $1,248,000 - $2,096,000
--
Bed
--
Bath
1,420
Sq Ft
$1,305/Sq Ft
Est. Value
About This Home
This home is located at 303 E 33rd St Unit 2A, New York, NY 10016 and is currently estimated at $1,853,209, approximately $1,305 per square foot. 303 E 33rd St Unit 2A is a home located in New York County with nearby schools including River School (The), Simon Baruch Middle School 104, and Clinton School.
Ownership History
Date
Name
Owned For
Owner Type
Purchase Details
Closed on
Aug 3, 2023
Sold by
Wender Adrienne and Wender Tod
Bought by
Marder-Mirman Eileen and Mirman James
Current Estimated Value
Home Financials for this Owner
Home Financials are based on the most recent Mortgage that was taken out on this home.
Original Mortgage
$1,400,000
Outstanding Balance
$1,367,501
Interest Rate
6.71%
Mortgage Type
Purchase Money Mortgage
Estimated Equity
$485,708
Purchase Details
Closed on
Oct 18, 2010
Sold by
Ktl 303 Llc
Bought by
Wender Adrienne and Wender Tod
Home Financials for this Owner
Home Financials are based on the most recent Mortgage that was taken out on this home.
Original Mortgage
$1,000,000
Interest Rate
4.39%
Mortgage Type
Purchase Money Mortgage
Create a Home Valuation Report for This Property
The Home Valuation Report is an in-depth analysis detailing your home's value as well as a comparison with similar homes in the area
Home Values in the Area
Average Home Value in this Area
Purchase History
| Date | Buyer | Sale Price | Title Company |
|---|---|---|---|
| Marder-Mirman Eileen | $2,135,000 | -- | |
| Wender Adrienne | $1,756,481 | -- |
Source: Public Records
Mortgage History
| Date | Status | Borrower | Loan Amount |
|---|---|---|---|
| Open | Marder-Mirman Eileen | $1,400,000 | |
| Previous Owner | Wender Adrienne | $1,000,000 |
Source: Public Records
Tax History Compared to Growth
Tax History
| Year | Tax Paid | Tax Assessment Tax Assessment Total Assessment is a certain percentage of the fair market value that is determined by local assessors to be the total taxable value of land and additions on the property. | Land | Improvement |
|---|---|---|---|---|
| 2025 | $26,770 | $214,547 | $20,071 | $194,476 |
| 2024 | $26,770 | $214,123 | $20,071 | $194,052 |
| 2023 | $21,488 | $216,613 | $20,071 | $196,542 |
| 2022 | $27,047 | $222,128 | $20,071 | $202,057 |
| 2021 | $25,618 | $208,840 | $20,071 | $188,769 |
| 2020 | $22,424 | $232,015 | $20,071 | $211,944 |
| 2019 | $22,247 | $232,896 | $20,071 | $212,825 |
| 2018 | $16,493 | $231,150 | $20,071 | $211,079 |
| 2017 | $15,521 | $220,221 | $20,072 | $200,149 |
| 2016 | $10,339 | $208,528 | $20,071 | $188,457 |
| 2015 | $1,022 | $217,308 | $20,071 | $197,237 |
| 2014 | $1,022 | $189,861 | $20,071 | $169,790 |
Source: Public Records
About 303 Residences
Map
Nearby Homes
- 303 E 33rd St Unit 2-M
- 303 E 33rd St Unit 7E
- 303 E 33rd St Unit 6-A
- 609 2nd Ave Unit 304
- 609 2nd Ave Unit 805
- 609 2nd Ave Unit 905
- 609 2nd Ave Unit 1404
- 609 2nd Ave Unit 604
- 609 2nd Ave Unit 303
- 609 2nd Ave Unit 702
- 609 2nd Ave Unit 1203
- 609 2nd Ave Unit 302
- 609 2nd Ave Unit 802
- 609 2nd Ave Unit 1202
- 609 2nd Ave Unit PH 2
- 609 2nd Ave Unit 1403
- 609 2nd Ave Unit 505
- 609 2nd Ave Unit 605
- 609 2nd Ave Unit 305
- 609 2nd Ave Unit 1102
- 303 E 33rd St
- 303 E 33rd St Unit B2
- 303 E 33rd St Unit 2A
- 303 E 33rd St Unit 2A
- 303 E 33rd St Unit 2A
- 303 E 33rd St Unit 2A
- 303 E 33rd St Unit 2A
- 303 E 33rd St Unit 2A
- 303 E 33rd St Unit 2A
- 303 E 33rd St Unit 2A
- 303 E 33rd St Unit 2A
- 303 E 33rd St Unit 2A
- 303 E 33rd St Unit 2A
- 303 E 33rd St Unit 2A
- 303 E 33rd St Unit 2A
- 303 E 33rd St Unit 2A
- 303 E 33rd St Unit 2A
- 303 E 33rd St Unit 2A
- 303 E 33rd St Unit 2A
- 303 E 33rd St Unit 2A