303 E Broad St Rutland, IL 61358
Estimated Value: $73,000 - $173,000
3
Beds
2
Baths
2,400
Sq Ft
$44/Sq Ft
Est. Value
About This Home
This home is located at 303 E Broad St, Rutland, IL 61358 and is currently estimated at $104,732, approximately $43 per square foot. 303 E Broad St is a home located in LaSalle County with nearby schools including Fieldcrest Elementary School - South, Fieldcrest Elementary School - West, and Fieldcrest High School.
Ownership History
Date
Name
Owned For
Owner Type
Purchase Details
Closed on
Nov 17, 2023
Sold by
Umphress Neil
Bought by
Swanson Alvin J and Swanson Jennifer S
Current Estimated Value
Purchase Details
Closed on
Oct 3, 2016
Sold by
Regions Bank
Bought by
Umphress Neil
Purchase Details
Closed on
Apr 6, 2011
Sold by
Realtax Developers Ltd
Bought by
Regions Bank
Purchase Details
Closed on
Mar 28, 2011
Sold by
Lasalle County Clark
Bought by
Realtax Developers Ltd
Create a Home Valuation Report for This Property
The Home Valuation Report is an in-depth analysis detailing your home's value as well as a comparison with similar homes in the area
Purchase History
| Date | Buyer | Sale Price | Title Company |
|---|---|---|---|
| Swanson Alvin J | $65,000 | None Available | |
| Umphress Neil | $16,176 | -- | |
| Regions Bank | $13,888 | None Available | |
| Realtax Developers Ltd | -- | None Available |
Source: Public Records
Tax History
| Year | Tax Paid | Tax Assessment Tax Assessment Total Assessment is a certain percentage of the fair market value that is determined by local assessors to be the total taxable value of land and additions on the property. | Land | Improvement |
|---|---|---|---|---|
| 2024 | $944 | $10,344 | $3,267 | $7,077 |
| 2023 | $833 | $9,137 | $2,886 | $6,251 |
| 2022 | $785 | $8,438 | $2,665 | $5,773 |
| 2021 | $771 | $8,334 | $2,632 | $5,702 |
| 2020 | $764 | $8,210 | $2,593 | $5,617 |
| 2019 | $752 | $8,210 | $2,593 | $5,617 |
| 2018 | $710 | $7,906 | $2,497 | $5,409 |
| 2017 | $682 | $7,590 | $2,397 | $5,193 |
| 2016 | $683 | $7,422 | $2,344 | $5,078 |
| 2015 | $656 | $7,059 | $2,229 | $4,830 |
| 2012 | -- | $6,905 | $2,180 | $4,725 |
Source: Public Records
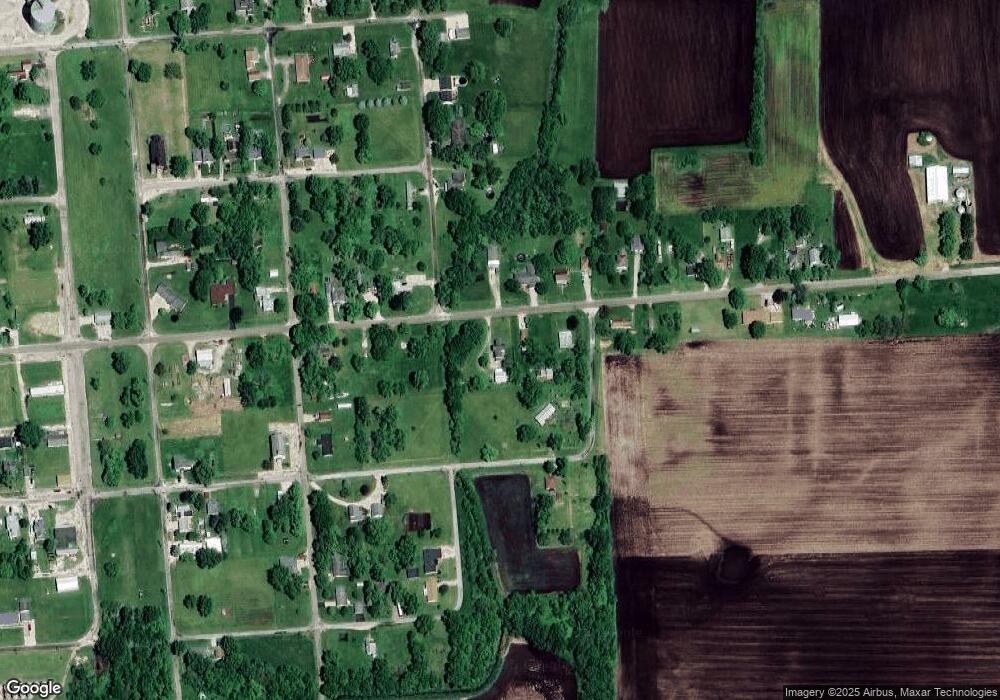
Map
Nearby Homes
- 203 E Chestnut St
- 107 N Front St
- 947 N 2nd Rd
- 0 S Maple St
- 201 S Maple St
- 0 S Oak St
- 112 E Jefferson St
- 208 E Washington St
- 216 W Santa fe Ave
- 734 Locust St
- 829 Lincoln St
- 707 W Santa fe Ave
- 2711 E 800 N
- 728 Claire St
- 2608 State Route 17
- 201 S Carson St
- 2278 County Road 300 N
- 111 N Reiter St
- 509 Vine St
- 2913 County Road 1700 N
- 305 E Broad St
- 307 E Broad St
- 309 E Broad St
- 306 E Broad St
- 110 Rowland St
- 207 E Broad St
- 308 E Broad St
- 208 E Broad St
- 101 Rowland St
- 205 E Broad St
- 204 E Broad St
- 202 E Broad St
- 101 S State St
- 111 N School St
- 209 E Chestnut St
- 105 S State St
- 200 E Broad St
- 205 E Chestnut St
- 400 E Broad St
- 200 E Market St
Your Personal Tour Guide
Ask me questions while you tour the home.