Estimated Value: $254,000 - $275,000
4
Beds
3
Baths
1,882
Sq Ft
$138/Sq Ft
Est. Value
About This Home
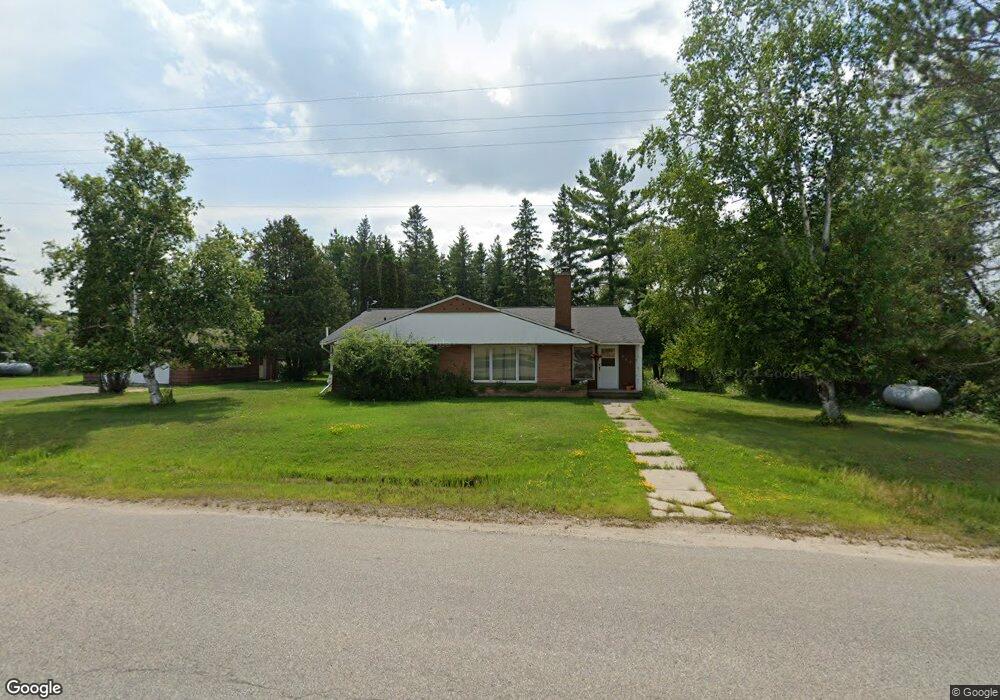
This home is located at 303 E Vermilion Blvd, Cook, MN 55723 and is currently estimated at $260,039, approximately $138 per square foot. 303 E Vermilion Blvd is a home located in St. Louis County with nearby schools including North Woods Elementary School.
Ownership History
Date
Name
Owned For
Owner Type
Purchase Details
Closed on
Feb 1, 2007
Sold by
Villebrun Rae M and Villebrun John L
Bought by
Beaudry Thomas H and Beaudry Stephanie A
Current Estimated Value
Home Financials for this Owner
Home Financials are based on the most recent Mortgage that was taken out on this home.
Original Mortgage
$142,140
Interest Rate
6.22%
Mortgage Type
Purchase Money Mortgage
Purchase Details
Closed on
Jan 31, 2007
Sold by
Hayes Michael D
Bought by
Villebrun Rae M
Home Financials for this Owner
Home Financials are based on the most recent Mortgage that was taken out on this home.
Original Mortgage
$142,140
Interest Rate
6.22%
Mortgage Type
Purchase Money Mortgage
Purchase Details
Closed on
May 30, 2001
Sold by
Folscher William and Folscher Diane
Bought by
Hayes Michael D and Hayes Rae M
Home Financials for this Owner
Home Financials are based on the most recent Mortgage that was taken out on this home.
Original Mortgage
$131,100
Interest Rate
7.16%
Create a Home Valuation Report for This Property
The Home Valuation Report is an in-depth analysis detailing your home's value as well as a comparison with similar homes in the area
Home Values in the Area
Average Home Value in this Area
Purchase History
| Date | Buyer | Sale Price | Title Company |
|---|---|---|---|
| Beaudry Thomas H | $142,139 | Northeast Title Company | |
| Beaudry Thomas H | $142,139 | Northeast Title Company | |
| Villebrun Rae M | -- | Northeast Title Company | |
| Hayes Michael D | $138,000 | Ati Title Company |
Source: Public Records
Mortgage History
| Date | Status | Borrower | Loan Amount |
|---|---|---|---|
| Previous Owner | Beaudry Thomas H | $142,140 | |
| Previous Owner | Hayes Michael D | $131,100 |
Source: Public Records
Tax History Compared to Growth
Tax History
| Year | Tax Paid | Tax Assessment Tax Assessment Total Assessment is a certain percentage of the fair market value that is determined by local assessors to be the total taxable value of land and additions on the property. | Land | Improvement |
|---|---|---|---|---|
| 2024 | $4,148 | $199,000 | $12,700 | $186,300 |
| 2023 | $4,148 | $196,800 | $10,500 | $186,300 |
| 2022 | $4,094 | $165,800 | $10,500 | $155,300 |
| 2021 | $2,188 | $165,800 | $10,500 | $155,300 |
| 2020 | $1,998 | $126,600 | $10,500 | $116,100 |
| 2019 | $1,908 | $118,300 | $10,500 | $107,800 |
| 2018 | $1,810 | $118,300 | $10,500 | $107,800 |
| 2017 | $1,600 | $118,300 | $10,500 | $107,800 |
| 2016 | $1,780 | $105,800 | $10,500 | $95,300 |
| 2015 | $2,017 | $104,500 | $12,700 | $91,800 |
| 2014 | $2,017 | $104,500 | $12,700 | $91,800 |
Source: Public Records
Map
Nearby Homes
- 322 S River St
- 411 S River St
- TBD- Parcel B Vermilion Dr
- TBD-Parcel A Vermilion Dr
- 9774 Wien Rd
- Parcel 10 TBD Highway 115
- Parcel 9 TBD Highway 115
- Parcel 8 TBD Highway 115
- Parcel 7 TBD Highway 115
- Parcel 13 TBD Highway 115
- Parcel 3 TBD Highway 115
- Parcel 2 TBD Highway 115
- Parcel 1 TBD Highway 115
- TBD3 Highway 115
- TBD2 Highway 115
- Parcel B Saint Louis Co 431
- 1637 Wakely Rd
- 8848 E Leander Rd
- Sec: 2 TWP: 61.0 RG:
- TBD Parcel B Vermilion Dr
- 307 E Vermilion Blvd
- 319 E Vermilion Blvd
- 302 E Vermilion Blvd
- 24 2nd St SE
- 410 1st Ave SE
- 402 1st Ave SE
- 10 W Vermilion Dr
- 405 E Vermilion Blvd
- 320 2nd Ave SE
- 401 1st Ave SE
- 102 2nd St SE
- 14 N Vermilion Dr
- 25 2nd St SE
- 106 2nd St E
- 29 2nd St SE
- 403 1st Ave SE
- 108 2nd St SE
- 408 1st Ave SE
- 409 E Vermilion Blvd
- 292 Po Box