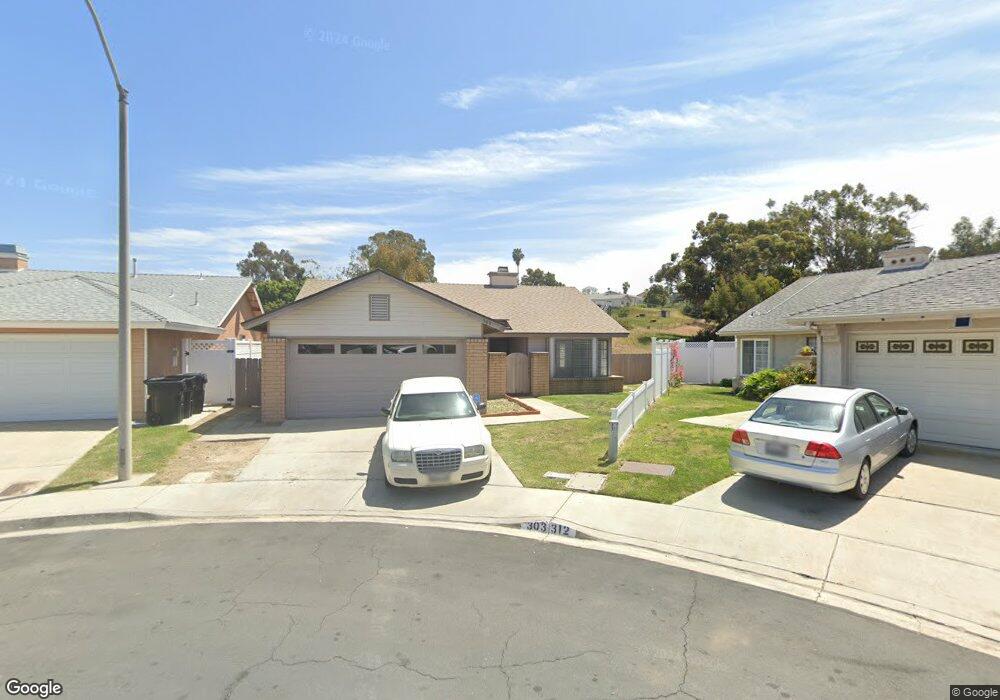
303 Falconfire Way San Diego, CA 92114
Skyline NeighborhoodEstimated Value: $635,000 - $839,000
3
Beds
2
Baths
1,322
Sq Ft
$557/Sq Ft
Est. Value
About This Home
This home is located at 303 Falconfire Way, San Diego, CA 92114 and is currently estimated at $736,787, approximately $557 per square foot. 303 Falconfire Way is a home located in San Diego County with nearby schools including Fulton UTK-8, Bell Middle School, and Morse High School.
Ownership History
Date
Name
Owned For
Owner Type
Purchase Details
Closed on
Dec 6, 2013
Sold by
Wilson Teresa Ann
Bought by
Wilson Teresa Ann
Current Estimated Value
Home Financials for this Owner
Home Financials are based on the most recent Mortgage that was taken out on this home.
Original Mortgage
$103,750
Interest Rate
4.04%
Mortgage Type
New Conventional
Purchase Details
Closed on
Mar 5, 2009
Sold by
Wilson Teresa Ann
Bought by
Wilson Teresa Ann
Home Financials for this Owner
Home Financials are based on the most recent Mortgage that was taken out on this home.
Original Mortgage
$135,000
Interest Rate
4.71%
Mortgage Type
New Conventional
Purchase Details
Closed on
Jan 25, 2007
Sold by
Wilson Teresa Ann
Bought by
Wilson Teresa Ann
Purchase Details
Closed on
Apr 3, 2006
Sold by
Wilson Teresa Ann
Bought by
Wilson Teresa Ann
Purchase Details
Closed on
Nov 20, 1992
Purchase Details
Closed on
Mar 13, 1987
Create a Home Valuation Report for This Property
The Home Valuation Report is an in-depth analysis detailing your home's value as well as a comparison with similar homes in the area
Home Values in the Area
Average Home Value in this Area
Purchase History
| Date | Buyer | Sale Price | Title Company |
|---|---|---|---|
| Wilson Teresa Ann | -- | Accommodation | |
| Wilson Teresa Ann | -- | Stewart Title Of California | |
| Wilson Teresa Ann | -- | Stewart Title Of California | |
| Wilson Teresa Ann | -- | Stewart Title Of California | |
| Wilson Teresa Ann | -- | None Available | |
| Wilson Teresa Ann | -- | None Available | |
| -- | $141,000 | -- | |
| -- | $95,600 | -- |
Source: Public Records
Mortgage History
| Date | Status | Borrower | Loan Amount |
|---|---|---|---|
| Closed | Wilson Teresa Ann | $103,750 | |
| Closed | Wilson Teresa Ann | $135,000 |
Source: Public Records
Tax History Compared to Growth
Tax History
| Year | Tax Paid | Tax Assessment Tax Assessment Total Assessment is a certain percentage of the fair market value that is determined by local assessors to be the total taxable value of land and additions on the property. | Land | Improvement |
|---|---|---|---|---|
| 2025 | $2,978 | $244,417 | $94,769 | $149,648 |
| 2024 | $2,978 | $239,625 | $92,911 | $146,714 |
| 2023 | $2,912 | $234,928 | $91,090 | $143,838 |
| 2022 | $2,834 | $230,322 | $89,304 | $141,018 |
| 2021 | $2,815 | $225,806 | $87,553 | $138,253 |
| 2020 | $2,781 | $223,492 | $86,656 | $136,836 |
| 2019 | $2,732 | $219,110 | $84,957 | $134,153 |
| 2018 | $2,556 | $214,815 | $83,292 | $131,523 |
| 2017 | $80 | $210,604 | $81,659 | $128,945 |
| 2016 | $2,454 | $206,475 | $80,058 | $126,417 |
| 2015 | $2,418 | $203,375 | $78,856 | $124,519 |
| 2014 | $2,381 | $199,392 | $77,312 | $122,080 |
Source: Public Records
Map
Nearby Homes
- 366 Lausanne Dr
- 7085 Madrone Ave
- 7358 Gribble St
- 7004 La Sena Ave
- 725 Peggy Dr
- 6988 Madrone Ave
- 7023 Lisbon St
- 348 Sychar Rd
- 7936 Pala St
- 218 Elvado Way
- 7263 Aquamarine Rd
- 238 69th St
- 249 Meadowbrook Dr
- 284 Middlebush Dr
- 111 69th St
- 1062 Armacost Rd
- 7853 Gribble St
- 124 Palawan Way
- 8017 Gribble St
- 753 Jacumba St
- 313 Falconfire Way
- 312 Falconfire Way
- 410 Lausanne Dr
- 330 Falconfire Way
- 390 Lausanne Dr
- 323 Falconfire Way
- 338 Falconfire Way
- 333 Falconfire Way
- 430 Lausanne Dr
- 378 Lausanne Dr
- 343 Falconfire Way
- 346 Falconfire Way
- 327 Dolo St
- 353 Falconfire Way
- 315 Dolo St
- 7291 Jacmar Ave
- 352 Falconfire Way
- 335 Dolo St
- 415 Lausanne Dr
- 7281 Jacmar Ave