NOT LISTED FOR SALE

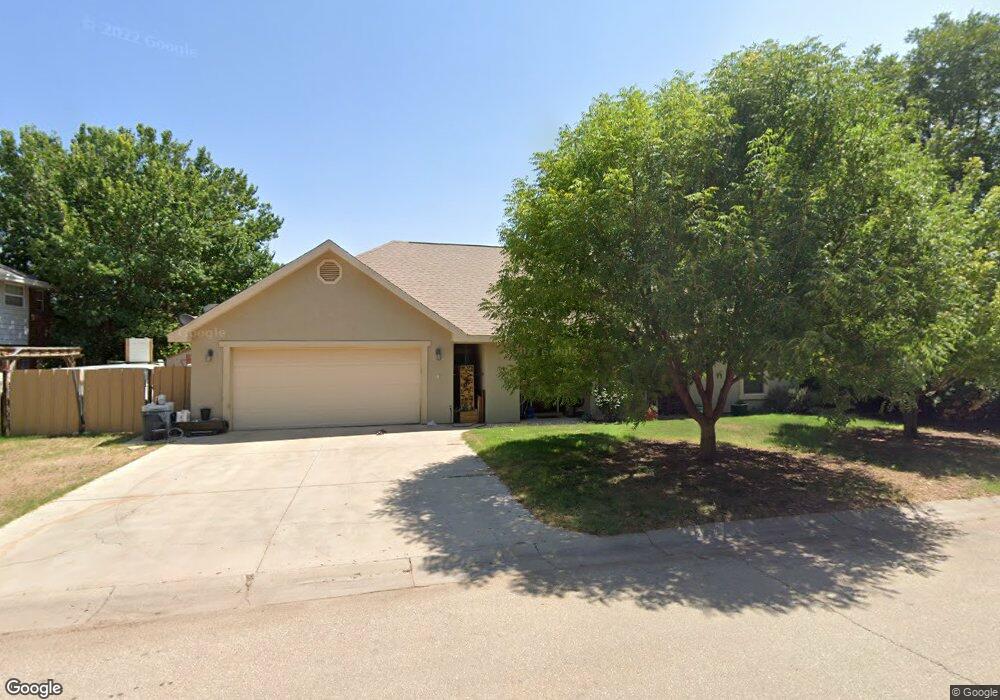
303 Farrell Dr Carlsbad, NM 88220

Estimated Value: $311,063 - $436,000

-- Bed
-- Bath
2,581 Sq Ft
$137/Sq Ft Est. Value

About This Home

This home is located at 303 Farrell Dr, Carlsbad, NM 88220 and is currently estimated at $353,766, approximately $137 per square foot. 303 Farrell Dr is a home with nearby schools including Ocotillo Elementary School, PR Leyva CIS, and Carlsbad High School.

Ownership History

Date Name Owned For Owner Type

Purchase Details

Closed on
Aug 23, 2024
Sold by
Folsom Kristin M and Folsom Reid A
Bought by
Folsom Lyle R and Folsom Mi Yung
Current Estimated Value
$353,766

Home Financials for this Owner

Home Financials are based on the most recent Mortgage that was taken out on this home.
Original Mortgage
$248,000
Outstanding Balance
$247,761
Interest Rate
6.17%
Mortgage Type
New Conventional

Purchase Details

Closed on
Aug 18, 2008
Sold by
New Mizz Home Llc
Bought by
Folsom Reid A and Folsom Kristin T

Home Financials for this Owner

Home Financials are based on the most recent Mortgage that was taken out on this home.
Original Mortgage
$168,000
Interest Rate
6.29%
Mortgage Type
New Conventional

Purchase Details

Closed on
Feb 11, 2008
Sold by
Knowlton Bryan and Knowlton Janell
Bought by
New Mizz Homes Llc

Home Financials for this Owner

Home Financials are based on the most recent Mortgage that was taken out on this home.
Original Mortgage
$168,000
Interest Rate
7%
Mortgage Type
Construction

Range of Values:

Collateral Analytics

Collateral Analytics Collateral Analytics AVMs (Automated Valuation Model) employ a number of statistical approaches combined with neighborhood-specific comparable selection guarantees the most up-to-date and precise valuations.

Not Available

Collateral Analytics does not have data for the current month. Please view the chart for historical values.

ICE

ICE Mortgage Technology ICE Mortgage Technology’s AVM (Automated Valuation Model) is a state-of-the-art online residential property valuation tool that provides a quick and accurate estimate of the value of almost any home in the U.S.

Not Available

ICE Mortgage Technology does not have data for the current month. Please view the chart for historical values.

First American

First American First American Data & Analytics’ next-generation AVM combines unrivaled data assets with a blended ensemble of valuation models to produce highly accurate, reliable valuations you can trust.

Not Available

First American does not have data for the current month. Please view the chart for historical values.

Quantarium

Quantarium Quantarium’s valuation service, repeatedly proven the industry’s most accurate and comprehensive, is supercharged with a self-learning and auto-tuning AI engine that continually becomes smarter and more accurate as it processes daily inputs from the industry’s leading RE data lake.

Not Available

Quantarium does not have data for the current month. Please view the chart for historical values.

Average Value
Not Available
List Price
Sold Price
Create a Home Valuation Report for This Property
The Home Valuation Report is an in-depth analysis detailing your home's value as well as a comparison with similar homes in the area

Home Values in the Area

Source: Public Records

Average Home Value in this Area


Source: Public Records

Purchase History

Date Buyer Sale Price Title Company
Folsom Lyle R -- Pioneer Title
Folsom Reid A -- Guaranty Title Co
New Mizz Homes Llc -- Guaranty Title Co
Source: Public Records

Mortgage History

Date Status Borrower Loan Amount
Open Folsom Lyle R $248,000
Previous Owner Folsom Reid A $164,000
Previous Owner Folsom Reid A $168,000
Previous Owner New Mizz Homes Llc $168,000
Source: Public Records

Tax History Compared to Growth

Source: Public Records

Tax History

Year Tax Paid Tax Assessment Tax Assessment Total Assessment is a certain percentage of the fair market value that is determined by local assessors to be the total taxable value of land and additions on the property. Land Improvement
2024 $1,883 $75,724 $8,196 $67,528
2023 $1,883 $75,724 $8,196 $67,528
2022 $1,869 $75,724 $8,196 $67,528
2021 $1,861 $75,724 $8,196 $67,528
2020 $40 $75,724 $8,196 $67,528
2019 $1,923 $75,724 $8,196 $67,528
2018 $1,915 $75,724 $8,196 $67,528
2017 $1,867 $74,366 $8,442 $65,924
2015 $1,889 $0 $0 $0
2014 $1,713 $0 $0 $0
Source: Public Records

Map