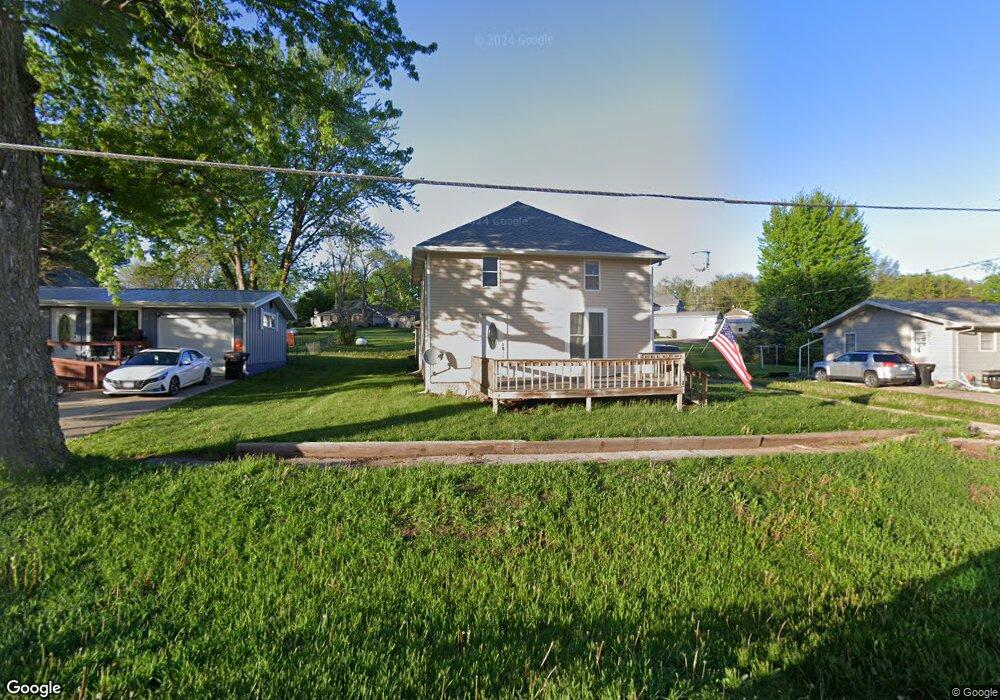
303 Front St Pierson, IA 51048
Estimated Value: $90,000 - $137,502
3
Beds
1
Bath
1,642
Sq Ft
$71/Sq Ft
Est. Value
About This Home
This home is located at 303 Front St, Pierson, IA 51048 and is currently estimated at $116,876, approximately $71 per square foot. 303 Front St is a home located in Woodbury County with nearby schools including Pierson Elementary School, Pierson Middle School, and Kingsley-Pierson High School.
Ownership History
Date
Name
Owned For
Owner Type
Purchase Details
Closed on
Sep 26, 2008
Sold by
Muecke Jacob R
Bought by
Colborn Andrew and Putzier Laura
Current Estimated Value
Home Financials for this Owner
Home Financials are based on the most recent Mortgage that was taken out on this home.
Original Mortgage
$68,867
Outstanding Balance
$45,916
Interest Rate
6.57%
Mortgage Type
FHA
Estimated Equity
$70,960
Purchase Details
Closed on
Jun 6, 2005
Sold by
Koch Esther
Bought by
Muecke Jacob R
Home Financials for this Owner
Home Financials are based on the most recent Mortgage that was taken out on this home.
Original Mortgage
$24,000
Interest Rate
5.91%
Mortgage Type
New Conventional
Create a Home Valuation Report for This Property
The Home Valuation Report is an in-depth analysis detailing your home's value as well as a comparison with similar homes in the area
Home Values in the Area
Average Home Value in this Area
Purchase History
| Date | Buyer | Sale Price | Title Company |
|---|---|---|---|
| Colborn Andrew | $70,000 | -- | |
| Muecke Jacob R | $22,500 | None Available |
Source: Public Records
Mortgage History
| Date | Status | Borrower | Loan Amount |
|---|---|---|---|
| Open | Colborn Andrew | $68,867 | |
| Previous Owner | Muecke Jacob R | $24,000 |
Source: Public Records
Tax History Compared to Growth
Tax History
| Year | Tax Paid | Tax Assessment Tax Assessment Total Assessment is a certain percentage of the fair market value that is determined by local assessors to be the total taxable value of land and additions on the property. | Land | Improvement |
|---|---|---|---|---|
| 2025 | $1,754 | $97,720 | $5,090 | $92,630 |
| 2024 | $1,754 | $108,560 | $5,090 | $103,470 |
| 2023 | $1,706 | $108,560 | $5,090 | $103,470 |
| 2022 | $1,682 | $80,720 | $5,090 | $75,630 |
| 2021 | $1,682 | $80,720 | $5,090 | $75,630 |
| 2020 | $1,416 | $66,160 | $5,450 | $60,710 |
| 2019 | $1,366 | $66,160 | $5,450 | $60,710 |
| 2018 | $1,408 | $61,830 | $5,450 | $56,380 |
| 2017 | $1,408 | $61,830 | $5,450 | $56,380 |
| 2016 | $1,420 | $61,830 | $0 | $0 |
| 2015 | $1,345 | $57,780 | $5,090 | $52,690 |
| 2014 | $1,315 | $57,780 | $5,090 | $52,690 |
Source: Public Records
Map
Nearby Homes