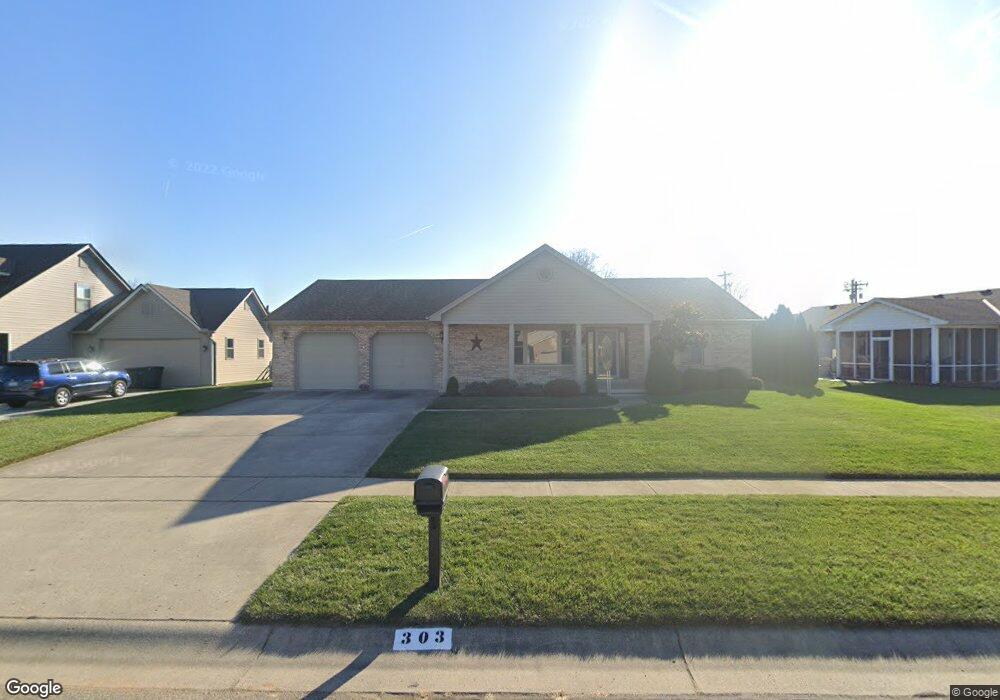
303 Harmony Dr Harrison, OH 45030
Estimated Value: $387,000 - $468,000
3
Beds
2
Baths
2,002
Sq Ft
$208/Sq Ft
Est. Value
About This Home
This home is located at 303 Harmony Dr, Harrison, OH 45030 and is currently estimated at $416,289, approximately $207 per square foot. 303 Harmony Dr is a home located in Hamilton County with nearby schools including William Henry Harrison High School, St. John The Baptist School, and Summit Academy of Southwest Ohio.
Ownership History
Date
Name
Owned For
Owner Type
Purchase Details
Closed on
May 31, 2023
Sold by
Radcliffe Russell E and Radcliffe Rosina W
Bought by
Radcliffe Family Trust and Radcliffe
Current Estimated Value
Purchase Details
Closed on
Apr 26, 2022
Sold by
Paul Bybee And Mariann Bybee Trust
Bought by
Radcliffe Russell E and Radcliffe Rosina W
Purchase Details
Closed on
Mar 18, 2004
Sold by
Bybee Paul M and Bybee Mariann H
Bought by
Bybee Paul and Bybee Mariann
Purchase Details
Closed on
Aug 28, 2003
Sold by
Grubbs Hillman C and Grubbs Marcella M
Bought by
Bybee Paul M and Bybee Mariann H
Home Financials for this Owner
Home Financials are based on the most recent Mortgage that was taken out on this home.
Original Mortgage
$90,000
Interest Rate
6.18%
Mortgage Type
Unknown
Purchase Details
Closed on
Jun 4, 1999
Sold by
Grubbs Hillman C and Grubbs Marcella M
Bought by
Grubbs Hillman C and Grubbs Marcella M
Create a Home Valuation Report for This Property
The Home Valuation Report is an in-depth analysis detailing your home's value as well as a comparison with similar homes in the area
Home Values in the Area
Average Home Value in this Area
Purchase History
| Date | Buyer | Sale Price | Title Company |
|---|---|---|---|
| Radcliffe Family Trust | $250 | None Listed On Document | |
| Radcliffe Russell E | $400,000 | Donald Notary Commission | |
| Bybee Paul | -- | -- | |
| Bybee Paul M | $210,000 | Advanced Land Title Agency L | |
| Grubbs Hillman C | -- | -- |
Source: Public Records
Mortgage History
| Date | Status | Borrower | Loan Amount |
|---|---|---|---|
| Previous Owner | Bybee Paul M | $90,000 |
Source: Public Records
Tax History
| Year | Tax Paid | Tax Assessment Tax Assessment Total Assessment is a certain percentage of the fair market value that is determined by local assessors to be the total taxable value of land and additions on the property. | Land | Improvement |
|---|---|---|---|---|
| 2025 | $6,257 | $140,000 | $13,650 | $126,350 |
| 2023 | $6,277 | $140,000 | $13,650 | $126,350 |
| 2022 | $3,795 | $82,943 | $11,970 | $70,973 |
| 2021 | $3,744 | $82,943 | $11,970 | $70,973 |
| 2020 | $3,798 | $82,943 | $11,970 | $70,973 |
| 2019 | $3,424 | $72,758 | $10,500 | $62,258 |
| 2018 | $3,443 | $72,758 | $10,500 | $62,258 |
| 2017 | $3,243 | $72,758 | $10,500 | $62,258 |
| 2016 | $2,923 | $71,338 | $9,433 | $61,905 |
| 2015 | $2,964 | $71,338 | $9,433 | $61,905 |
| 2014 | $2,826 | $71,338 | $9,433 | $61,905 |
| 2013 | $2,913 | $72,793 | $9,625 | $63,168 |
Source: Public Records
Map
Nearby Homes
- 0 Carolina Trace Rd Unit 1840792
- 0 New Haven Rd Unit 1867315
- 10705 Carolina Pines Dr
- 207 Biddle Ave
- 155 Turner Ridge Dr
- 157 Turner Ridge Dr
- 119 Mackie Ln
- 163 Turner Ridge Dr
- 9864 Baughman Rd
- 10502 West Rd
- 483 Heritage Square
- 10638 New Biddinger Rd
- 10630 New Biddinger Rd
- 10648 New Biddinger Rd
- 11136 New Biddinger Rd
- 125 Hopping Ct
- 10655 New Biddinger Rd
- 10485 New Biddinger Rd
- 10803 Stone Ridge Way Unit 15
- 10419 New Biddinger Rd
- 305 Harmony Dr
- 10210 Carolina Trace Rd
- 307 Harmony Dr
- 304 Harmony Dr
- 309 Harmony Dr
- 302 Harmony Dr
- 306 Harmony Dr
- 308 Harmony Dr
- 10212 Carolina Trace Rd
- 0 Carolina Trace Rd Unit 1595791
- 0 Carolina Trace Rd Unit Lot 3 1594163
- 0 Carolina Trace Rd
- 0 Carolina Trace Rd Unit 1790484
- 0 Carolina Trace Rd Unit 6.41ac 1740834
- 0 Carolina Trace Rd Unit 1078384
- 0 Carolina Trace Rd Unit 767962
- 0 Carolina Trace Rd Unit 737835
- 0 Carolina Trace Rd Unit 633660
- 0 Carolina Trace Rd Unit 631717
- 0 Carolina Trace Rd Unit 586095
Your Personal Tour Guide
Ask me questions while you tour the home.