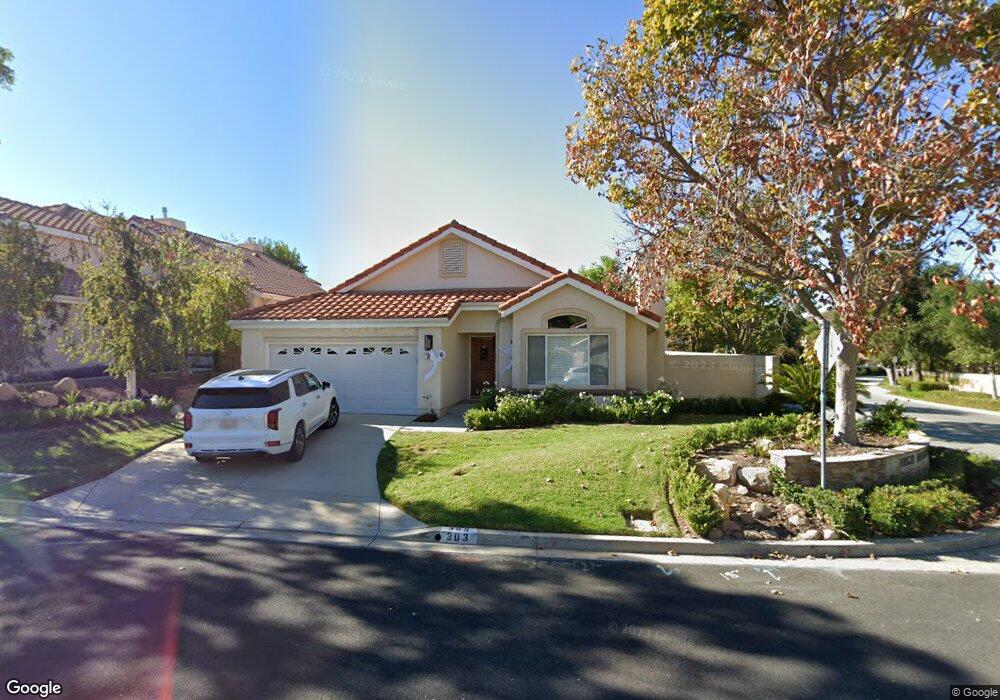
303 Hornblend Ct Simi Valley, CA 93065
Wood Ranch NeighborhoodEstimated Value: $939,463 - $1,063,000
3
Beds
2
Baths
1,822
Sq Ft
$547/Sq Ft
Est. Value
About This Home
This home is located at 303 Hornblend Ct, Simi Valley, CA 93065 and is currently estimated at $997,366, approximately $547 per square foot. 303 Hornblend Ct is a home located in Ventura County with nearby schools including Wood Ranch Elementary School, Sinaloa Middle School, and Royal High School.
Ownership History
Date
Name
Owned For
Owner Type
Purchase Details
Closed on
Dec 20, 2010
Sold by
Sommerhauser Richard Louis and Sommerhauser Dorothy Hazel
Bought by
Sommerhauser Richard L and Sommerhauser Dorothy H
Current Estimated Value
Purchase Details
Closed on
Jun 8, 2006
Sold by
Lamont Peter F and Lamont Trudy L
Bought by
Sommerhauser Richard Louis and Sommerhauser Dorothy Hazel
Create a Home Valuation Report for This Property
The Home Valuation Report is an in-depth analysis detailing your home's value as well as a comparison with similar homes in the area
Home Values in the Area
Average Home Value in this Area
Purchase History
| Date | Buyer | Sale Price | Title Company |
|---|---|---|---|
| Sommerhauser Richard L | -- | None Available | |
| Sommerhauser Richard Louis | $705,000 | First American Title Ins Co |
Source: Public Records
Tax History Compared to Growth
Tax History
| Year | Tax Paid | Tax Assessment Tax Assessment Total Assessment is a certain percentage of the fair market value that is determined by local assessors to be the total taxable value of land and additions on the property. | Land | Improvement |
|---|---|---|---|---|
| 2025 | $2,213 | $140,786 | $46,055 | $94,731 |
| 2024 | $2,213 | $138,026 | $45,152 | $92,874 |
| 2023 | $2,076 | $135,320 | $44,267 | $91,053 |
| 2022 | $2,034 | $132,667 | $43,399 | $89,268 |
| 2021 | $1,989 | $130,066 | $42,548 | $87,518 |
| 2020 | $1,927 | $128,734 | $42,112 | $86,622 |
| 2019 | $1,834 | $126,211 | $41,287 | $84,924 |
| 2018 | $1,798 | $123,737 | $40,478 | $83,259 |
| 2017 | $1,742 | $121,312 | $39,685 | $81,627 |
| 2016 | $1,656 | $118,934 | $38,907 | $80,027 |
| 2015 | $1,605 | $117,150 | $38,324 | $78,826 |
| 2014 | $1,564 | $114,857 | $37,574 | $77,283 |
Source: Public Records
Map
Nearby Homes
- 625 Brademas Ct
- 658 Elevar Ct
- 607 Hawks Bill Place
- 560 Granite Hills St
- 768 Twin Peaks Ave
- 3374 Country Home Ct
- 368 Pellburne Ct
- 335 Kitetail St
- 519 Turnbury St
- 12 Golden Glen Dr
- 48 Golden Glen Dr
- 508 Bannister Way Unit B
- 596 Fenwick Way Unit C
- 125 Heath Meadow Place
- 3194 Sunset Hills Blvd
- 259 Tilden Ct
- 544 Hooper Ave
- 618 Kirkside Place
- 713 Twillin Ct
- 311 Hornblend Ct
- 304 Cliffhollow Ct
- 319 Hornblend Ct
- 312 Cliffhollow Ct
- 693 Brademas Ct
- 324 Cliffhollow Ct
- 302 Hornblend Ct
- 310 Hornblend Ct
- 327 Hornblend Ct
- 689 Brademas Ct
- 318 Hornblend Ct
- 328 Cliffhollow Ct
- 685 Brademas Ct
- 326 Hornblend Ct
- 698 Sedgeworth Ct
- 692 Sedgeworth Ct
- 335 Hornblend Ct
- 705 Cranmont Ct
- 688 Sedgeworth Ct
- 336 Cliffhollow Ct