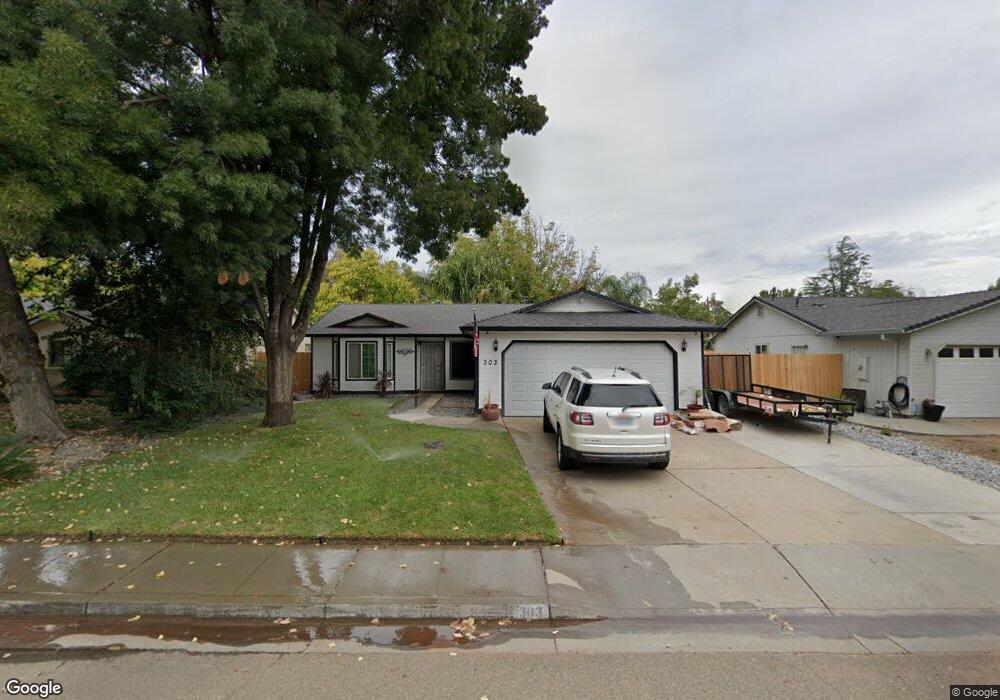
303 Pinon Way Red Bluff, CA 96080
Estimated Value: $235,000 - $372,000
3
Beds
2
Baths
1,348
Sq Ft
$232/Sq Ft
Est. Value
About This Home
This home is located at 303 Pinon Way, Red Bluff, CA 96080 and is currently estimated at $312,423, approximately $231 per square foot. 303 Pinon Way is a home located in Tehama County with nearby schools including Jackson Heights Elementary School, Vista Preparatory Academy, and Red Bluff High School.
Ownership History
Date
Name
Owned For
Owner Type
Purchase Details
Closed on
Nov 16, 2021
Sold by
Gavris Jim and Gavris Maria
Bought by
Gavris Mike V and Gavris Jean A
Current Estimated Value
Home Financials for this Owner
Home Financials are based on the most recent Mortgage that was taken out on this home.
Original Mortgage
$123,500
Outstanding Balance
$113,166
Interest Rate
2.99%
Mortgage Type
New Conventional
Estimated Equity
$199,257
Purchase Details
Closed on
Jun 29, 2009
Sold by
Federal Home Loan Mortgage Corporation
Bought by
Gavris Jim and Gavris Maria
Home Financials for this Owner
Home Financials are based on the most recent Mortgage that was taken out on this home.
Original Mortgage
$153,642
Interest Rate
4.79%
Mortgage Type
FHA
Purchase Details
Closed on
Feb 24, 2009
Sold by
Russell Charles E and Russell Colette R
Bought by
Federal Home Loan Mortgage Corporation
Create a Home Valuation Report for This Property
The Home Valuation Report is an in-depth analysis detailing your home's value as well as a comparison with similar homes in the area
Home Values in the Area
Average Home Value in this Area
Purchase History
| Date | Buyer | Sale Price | Title Company |
|---|---|---|---|
| Gavris Mike V | $130,000 | Placer Title Company | |
| Gavris Jim | $160,000 | First American Title | |
| Federal Home Loan Mortgage Corporation | $175,000 | None Available |
Source: Public Records
Mortgage History
| Date | Status | Borrower | Loan Amount |
|---|---|---|---|
| Open | Gavris Mike V | $123,500 | |
| Previous Owner | Gavris Jim | $153,642 |
Source: Public Records
Tax History Compared to Growth
Tax History
| Year | Tax Paid | Tax Assessment Tax Assessment Total Assessment is a certain percentage of the fair market value that is determined by local assessors to be the total taxable value of land and additions on the property. | Land | Improvement |
|---|---|---|---|---|
| 2025 | $2,028 | $206,519 | $51,627 | $154,892 |
| 2023 | $1,992 | $198,501 | $49,623 | $148,878 |
| 2022 | $1,992 | $194,609 | $48,650 | $145,959 |
| 2021 | $1,896 | $190,795 | $47,697 | $143,098 |
| 2020 | $1,935 | $188,839 | $47,208 | $141,631 |
| 2019 | $1,946 | $185,137 | $46,283 | $138,854 |
| 2018 | $1,798 | $181,508 | $45,376 | $136,132 |
| 2017 | $1,813 | $177,950 | $44,487 | $133,463 |
| 2016 | $1,692 | $174,462 | $43,615 | $130,847 |
| 2015 | $1,664 | $171,842 | $42,960 | $128,882 |
| 2014 | $1,639 | $168,477 | $42,119 | $126,358 |
Source: Public Records
Map
Nearby Homes