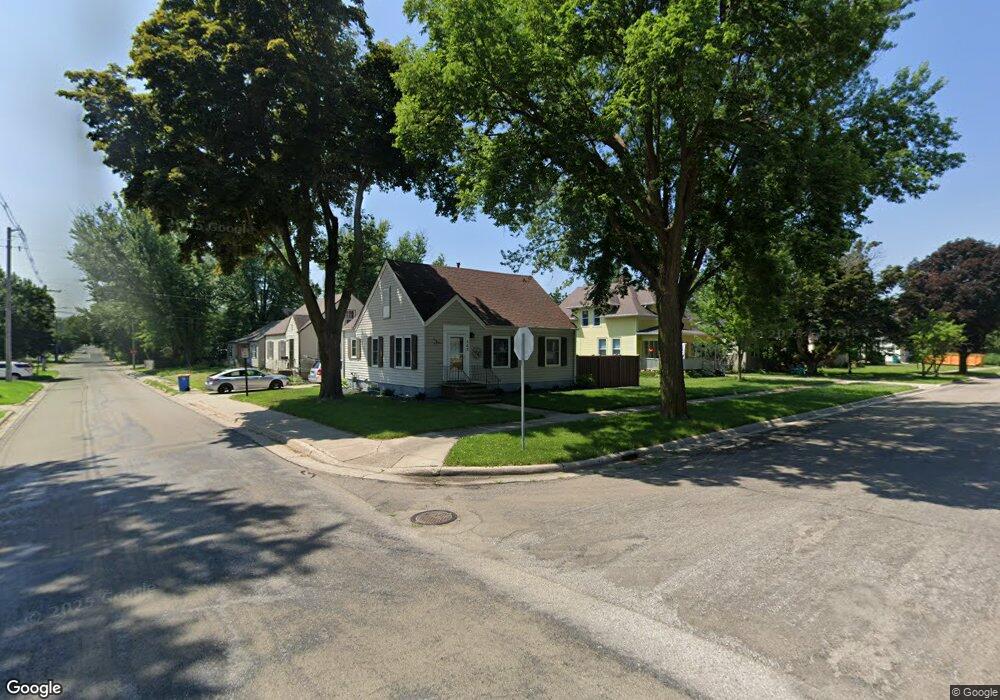
303 Plainview St Owatonna, MN 55060
Estimated Value: $179,000 - $203,000
2
Beds
1
Bath
858
Sq Ft
$219/Sq Ft
Est. Value
About This Home
This home is located at 303 Plainview St, Owatonna, MN 55060 and is currently estimated at $188,182, approximately $219 per square foot. 303 Plainview St is a home located in Steele County with nearby schools including Wilson Elementary School, Owatonna Middle School, and Owatonna Senior High School.
Ownership History
Date
Name
Owned For
Owner Type
Purchase Details
Closed on
Jan 16, 2008
Sold by
Federal Home Loan Mortgage Corporation
Bought by
Hallet Craig
Current Estimated Value
Home Financials for this Owner
Home Financials are based on the most recent Mortgage that was taken out on this home.
Original Mortgage
$68,347
Outstanding Balance
$43,277
Interest Rate
6.22%
Mortgage Type
New Conventional
Estimated Equity
$144,905
Purchase Details
Closed on
Dec 18, 2007
Sold by
Countrywide Home Loans Inc
Bought by
Federal Home Loan Mortgage Corp
Home Financials for this Owner
Home Financials are based on the most recent Mortgage that was taken out on this home.
Original Mortgage
$68,347
Outstanding Balance
$43,277
Interest Rate
6.22%
Mortgage Type
New Conventional
Estimated Equity
$144,905
Purchase Details
Closed on
Apr 19, 2007
Sold by
Reese Gary Lee
Bought by
Countrywide Home Loans Inc
Create a Home Valuation Report for This Property
The Home Valuation Report is an in-depth analysis detailing your home's value as well as a comparison with similar homes in the area
Home Values in the Area
Average Home Value in this Area
Purchase History
| Date | Buyer | Sale Price | Title Company |
|---|---|---|---|
| Hallet Craig | -- | Burnet Title | |
| Federal Home Loan Mortgage Corp | -- | None Available | |
| Countrywide Home Loans Inc | $90,367 | None Available |
Source: Public Records
Mortgage History
| Date | Status | Borrower | Loan Amount |
|---|---|---|---|
| Open | Hallet Craig | $68,347 |
Source: Public Records
Tax History Compared to Growth
Tax History
| Year | Tax Paid | Tax Assessment Tax Assessment Total Assessment is a certain percentage of the fair market value that is determined by local assessors to be the total taxable value of land and additions on the property. | Land | Improvement |
|---|---|---|---|---|
| 2025 | $1,954 | $161,600 | $20,200 | $141,400 |
| 2024 | $1,868 | $155,900 | $22,800 | $133,100 |
| 2023 | $1,888 | $142,100 | $16,900 | $125,200 |
| 2022 | $1,628 | $138,400 | $16,100 | $122,300 |
| 2021 | $1,480 | $112,504 | $13,818 | $98,686 |
| 2020 | $1,178 | $103,684 | $13,818 | $89,866 |
| 2019 | $856 | $85,554 | $11,858 | $73,696 |
| 2018 | $840 | $70,462 | $10,878 | $59,584 |
| 2017 | $802 | $69,090 | $10,878 | $58,212 |
| 2016 | $850 | $65,954 | $10,878 | $55,076 |
| 2015 | -- | $0 | $0 | $0 |
| 2014 | -- | $0 | $0 | $0 |
Source: Public Records
Map
Nearby Homes
- 916 Linn Ave SW
- 329 Plainview St
- 1015 Grandview Ave
- 1052 Grandview Ave
- xxx Anderson Place
- 522 S Oak Ave
- 332 13th St SW
- 228 13th St SW
- 421 S Oak Ave
- 1003 S Elm Ave
- 216 Prospect St
- 1223 S Cedar Ave
- 203 E Mckinley St
- 240 South St
- 468 Mound St
- 233 E School St
- 234 E School St
- 234 Selby Ave
- 323 Murray St
- 840 SW Riverwood Place
- 908 Linn Ave
- 309 Plainview St
- 253 Plainview St
- 313 Plainview St
- 916 Linn Ave
- 249 Plainview St
- 909 Linn Ave
- 304 Plainview St
- 310 Plainview St
- 319 Plainview St
- 254 Plainview St
- 314 Plainview St
- 314 Southview St
- 306 Southview St
- 243 Plainview St
- 256 Southview St
- 325 Plainview St
- 320 Plainview St
- 320 Southview St
- 244 Plainview St