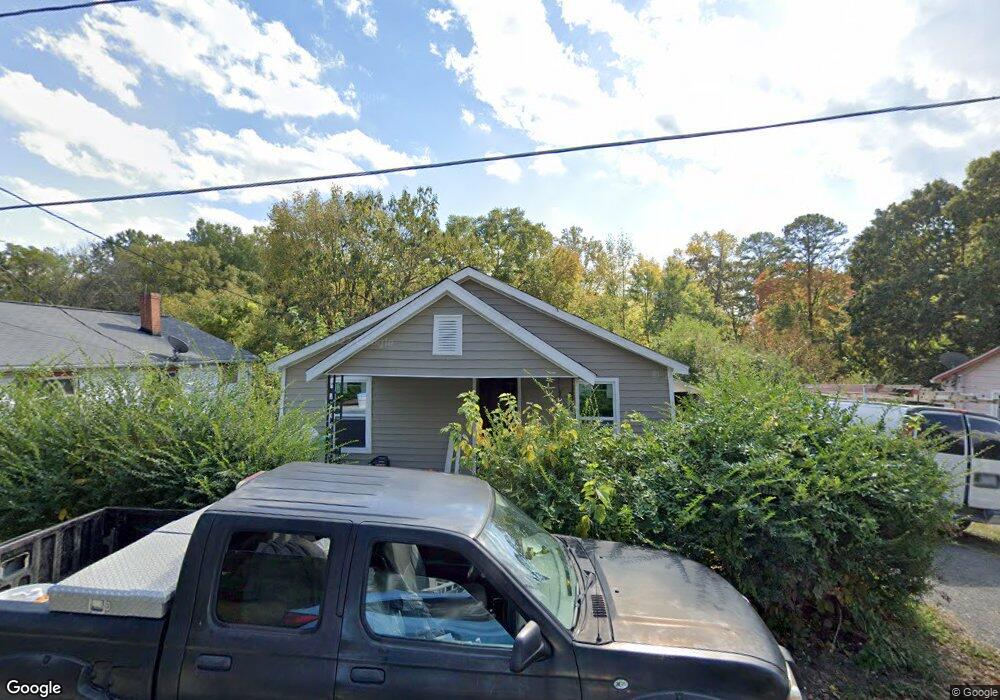
303 Rice St Kannapolis, NC 28081
Estimated Value: $199,000 - $291,440
--
Bed
1
Bath
816
Sq Ft
$278/Sq Ft
Est. Value
About This Home
This home is located at 303 Rice St, Kannapolis, NC 28081 and is currently estimated at $226,610, approximately $277 per square foot. 303 Rice St is a home located in Rowan County with nearby schools including Landis Elementary School, Corriher Lipe Middle School, and South Rowan High School.
Ownership History
Date
Name
Owned For
Owner Type
Purchase Details
Closed on
Apr 24, 2023
Sold by
Lem Jones Properties Llc
Bought by
Jones Lemuel
Current Estimated Value
Home Financials for this Owner
Home Financials are based on the most recent Mortgage that was taken out on this home.
Original Mortgage
$100,001
Outstanding Balance
$97,222
Interest Rate
6.6%
Mortgage Type
New Conventional
Estimated Equity
$129,388
Purchase Details
Closed on
Jan 31, 2022
Sold by
Broadway and Daphne
Bought by
Lem Jones Properties Llc
Create a Home Valuation Report for This Property
The Home Valuation Report is an in-depth analysis detailing your home's value as well as a comparison with similar homes in the area
Home Values in the Area
Average Home Value in this Area
Purchase History
| Date | Buyer | Sale Price | Title Company |
|---|---|---|---|
| Jones Lemuel | -- | None Listed On Document | |
| Jones Lemuel | -- | None Listed On Document | |
| Lem Jones Properties Llc | $290,000 | Peter F Morgan Pllc |
Source: Public Records
Mortgage History
| Date | Status | Borrower | Loan Amount |
|---|---|---|---|
| Open | Jones Lemuel | $100,001 | |
| Closed | Jones Lemuel | $100,001 |
Source: Public Records
Tax History Compared to Growth
Tax History
| Year | Tax Paid | Tax Assessment Tax Assessment Total Assessment is a certain percentage of the fair market value that is determined by local assessors to be the total taxable value of land and additions on the property. | Land | Improvement |
|---|---|---|---|---|
| 2025 | $1,580 | $130,582 | $16,413 | $114,169 |
| 2024 | $1,580 | $130,582 | $16,413 | $114,169 |
| 2023 | $1,580 | $130,582 | $16,413 | $114,169 |
| 2022 | $575 | $44,681 | $12,625 | $32,056 |
| 2021 | $575 | $44,681 | $12,625 | $32,056 |
| 2020 | $575 | $44,681 | $12,625 | $32,056 |
| 2019 | $575 | $44,681 | $12,625 | $32,056 |
| 2018 | $496 | $38,949 | $12,625 | $26,324 |
| 2017 | $496 | $38,949 | $12,625 | $26,324 |
| 2016 | $496 | $38,949 | $12,625 | $26,324 |
| 2015 | $503 | $38,949 | $12,625 | $26,324 |
| 2014 | $483 | $38,666 | $11,110 | $27,556 |
Source: Public Records
Map
Nearby Homes
- 301 Rice St
- 307 Rice St
- 221 Rice St
- 302 Rice St
- 220 Rice St
- 216 Blackwelder Ave Unit B
- 311 Rice St
- 304 Rice St
- 306 Blackwelder St
- 219 Rice St
- 306 Rice St
- 320 Blackwelder Ave
- 213 Rice St
- 301 Rosemont Ave
- 214 Blackwelder Ave
- 303 Rosemont Ave
- 310 Rice St
- 305 Rosemont Ave
- 2505 Brookside Ave
- 307 Rosemont Ave