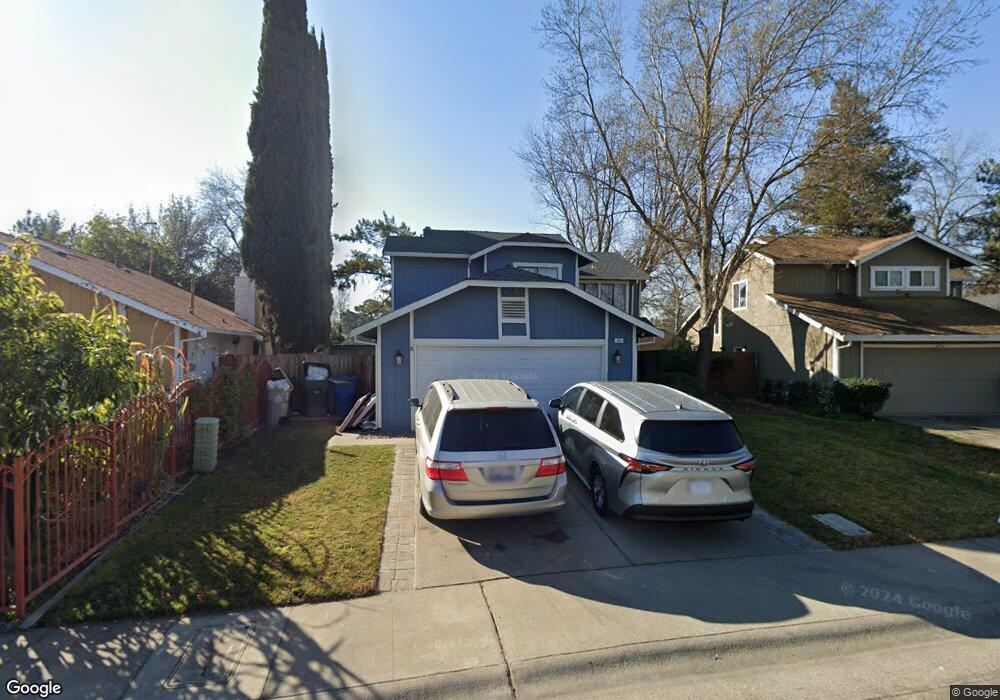
303 River Run Cir Sacramento, CA 95833
South Natomas NeighborhoodEstimated Value: $202,000 - $510,000
4
Beds
3
Baths
1,750
Sq Ft
$237/Sq Ft
Est. Value
About This Home
This home is located at 303 River Run Cir, Sacramento, CA 95833 and is currently estimated at $415,596, approximately $237 per square foot. 303 River Run Cir is a home located in Sacramento County with nearby schools including Hazel Strauch Elementary School, Rio Tierra Junior High School, and Grant Union High School.
Ownership History
Date
Name
Owned For
Owner Type
Purchase Details
Closed on
Jan 13, 2010
Sold by
Beneficial California Inc
Bought by
Jimenez Roger O and Jimenez Joann E
Current Estimated Value
Home Financials for this Owner
Home Financials are based on the most recent Mortgage that was taken out on this home.
Original Mortgage
$173,552
Outstanding Balance
$114,351
Interest Rate
5.02%
Mortgage Type
VA
Estimated Equity
$301,245
Purchase Details
Closed on
Jul 3, 2009
Sold by
Basquez Julio K and Basquez Loma C
Bought by
Beneficial California Inc
Purchase Details
Closed on
Sep 12, 2001
Sold by
Mcguire Frank R and Mcguire Dorothy R
Bought by
Basquez Julio K and Basquez Loma C
Home Financials for this Owner
Home Financials are based on the most recent Mortgage that was taken out on this home.
Original Mortgage
$175,500
Interest Rate
9.99%
Create a Home Valuation Report for This Property
The Home Valuation Report is an in-depth analysis detailing your home's value as well as a comparison with similar homes in the area
Home Values in the Area
Average Home Value in this Area
Purchase History
| Date | Buyer | Sale Price | Title Company |
|---|---|---|---|
| Jimenez Roger O | $170,000 | None Available | |
| Beneficial California Inc | -- | First American Title Ins Co | |
| Basquez Julio K | $195,000 | Placer Title Company |
Source: Public Records
Mortgage History
| Date | Status | Borrower | Loan Amount |
|---|---|---|---|
| Open | Jimenez Roger O | $173,552 | |
| Previous Owner | Basquez Julio K | $175,500 | |
| Closed | Basquez Julio K | $5,000 |
Source: Public Records
Tax History Compared to Growth
Tax History
| Year | Tax Paid | Tax Assessment Tax Assessment Total Assessment is a certain percentage of the fair market value that is determined by local assessors to be the total taxable value of land and additions on the property. | Land | Improvement |
|---|---|---|---|---|
| 2025 | $2,829 | $219,424 | $45,171 | $174,253 |
| 2024 | $2,829 | $215,123 | $44,286 | $170,837 |
| 2023 | $2,837 | $210,906 | $43,418 | $167,488 |
| 2022 | $2,675 | $206,771 | $42,567 | $164,204 |
| 2021 | $2,661 | $202,718 | $41,733 | $160,985 |
| 2020 | $2,633 | $200,641 | $41,306 | $159,335 |
| 2019 | $2,598 | $196,708 | $40,497 | $156,211 |
| 2018 | $2,480 | $192,852 | $39,703 | $153,149 |
| 2017 | $2,529 | $189,072 | $38,925 | $150,147 |
| 2016 | $2,449 | $185,365 | $38,162 | $147,203 |
| 2015 | $2,314 | $182,581 | $37,589 | $144,992 |
| 2014 | $2,353 | $179,005 | $36,853 | $142,152 |
Source: Public Records
Map
Nearby Homes
- 2803 Glen Arven Way
- 1177 Athena Ave
- 1112 Brunswick Way
- 1 Inca Ct
- 841 Haggin Ave
- 15 Hoy Lake Ct
- 2178 Sandcastle Way
- 3125 Iberian Dr
- 1105 Ciric Ave
- 865 Regatta Dr
- 1355 Senida Way
- 1053 Westward Way
- 721 Potomac Ave
- 2512 Norbert Way
- 3127 Mill Oak Way
- 19 Azorean Ct
- 56 Ishi Cir
- 1738 Bannon Creek Dr
- 42 Timberwood Ct
- 34 Timberwood Ct
- 299 River Run Cir
- 307 River Run Cir
- 295 River Run Cir
- 291 River Run Cir
- 304 River Run Cir
- 300 River Run Cir
- 296 River Run Cir
- 2910 Mendel Way
- 2904 Mendel Way
- 287 River Run Cir
- 2916 Mendel Way
- 1217 Fairweather Dr
- 292 River Run Cir
- 1240 Garaventa Way
- 283 River Run Cir
- 1200 Fall Creek Way
- 288 River Run Cir
- 1236 Garaventa Way
- 1206 Fall Creek Way
- 279 River Run Cir