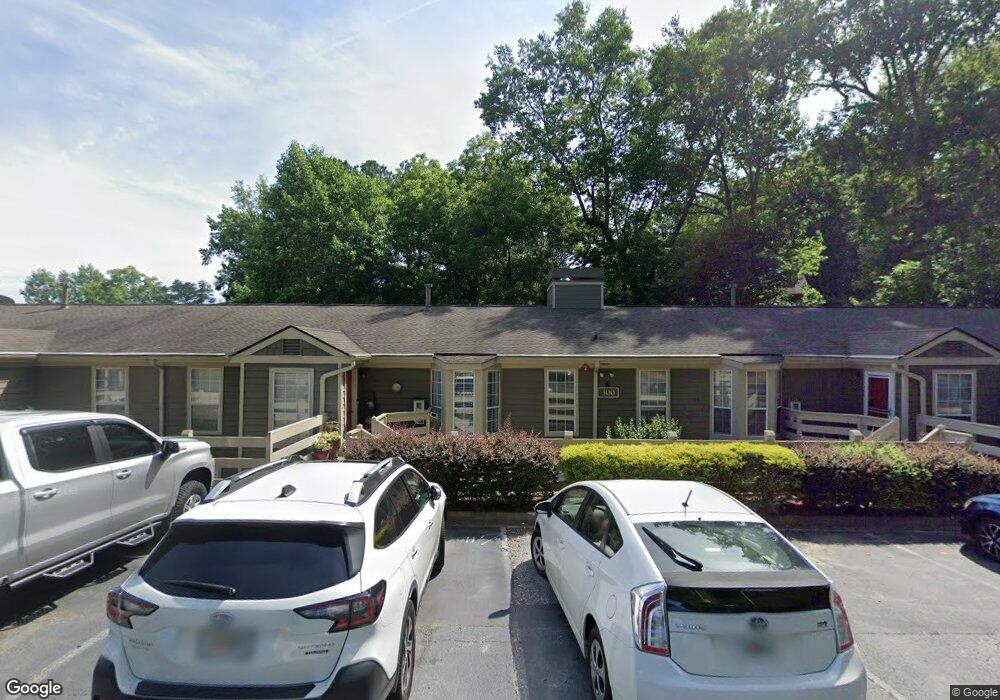
303 Riverview Dr SE Unit 303 Marietta, GA 30067
Southeast Cobb NeighborhoodEstimated Value: $311,000 - $542,000
2
Beds
2
Baths
1,495
Sq Ft
$292/Sq Ft
Est. Value
About This Home
This home is located at 303 Riverview Dr SE Unit 303, Marietta, GA 30067 and is currently estimated at $436,196, approximately $291 per square foot. 303 Riverview Dr SE Unit 303 is a home located in Cobb County with nearby schools including Sope Creek Elementary School and Dickerson Middle School.
Ownership History
Date
Name
Owned For
Owner Type
Purchase Details
Closed on
Dec 10, 2010
Sold by
Bever Michaell
Bought by
Bever Michaell and Bever Katherine
Current Estimated Value
Home Financials for this Owner
Home Financials are based on the most recent Mortgage that was taken out on this home.
Original Mortgage
$93,600
Outstanding Balance
$61,913
Interest Rate
4.32%
Mortgage Type
New Conventional
Estimated Equity
$374,283
Purchase Details
Closed on
Aug 1, 2008
Sold by
Hsbc Bk Usa
Bought by
Richardson Toni K
Home Financials for this Owner
Home Financials are based on the most recent Mortgage that was taken out on this home.
Original Mortgage
$113,905
Interest Rate
6.45%
Mortgage Type
Trade
Purchase Details
Closed on
Jun 3, 2008
Sold by
Russell Lorraine E
Bought by
Wells Fargo Trust 2006-2
Home Financials for this Owner
Home Financials are based on the most recent Mortgage that was taken out on this home.
Original Mortgage
$113,905
Interest Rate
6.45%
Mortgage Type
Trade
Create a Home Valuation Report for This Property
The Home Valuation Report is an in-depth analysis detailing your home's value as well as a comparison with similar homes in the area
Home Values in the Area
Average Home Value in this Area
Purchase History
| Date | Buyer | Sale Price | Title Company |
|---|---|---|---|
| Bever Michaell | $126,500 | -- | |
| Bever Michaell | $126,500 | -- | |
| Richardson Toni K | $119,900 | -- | |
| Wells Fargo Trust 2006-2 | $104,000 | -- |
Source: Public Records
Mortgage History
| Date | Status | Borrower | Loan Amount |
|---|---|---|---|
| Open | Bever Michaell | $93,600 | |
| Previous Owner | Richardson Toni K | $113,905 |
Source: Public Records
Tax History Compared to Growth
Tax History
| Year | Tax Paid | Tax Assessment Tax Assessment Total Assessment is a certain percentage of the fair market value that is determined by local assessors to be the total taxable value of land and additions on the property. | Land | Improvement |
|---|---|---|---|---|
| 2025 | $3,302 | $109,592 | $30,000 | $79,592 |
| 2024 | $3,304 | $109,592 | $30,000 | $79,592 |
| 2023 | $3,204 | $106,284 | $32,000 | $74,284 |
| 2022 | $2,600 | $85,672 | $22,000 | $63,672 |
| 2021 | $2,307 | $76,000 | $21,200 | $54,800 |
| 2020 | $2,088 | $68,800 | $14,000 | $54,800 |
| 2019 | $1,798 | $59,228 | $14,000 | $45,228 |
| 2018 | $1,798 | $59,228 | $14,000 | $45,228 |
| 2017 | $1,867 | $64,948 | $8,000 | $56,948 |
| 2016 | $1,418 | $49,328 | $10,000 | $39,328 |
| 2015 | $1,226 | $41,612 | $10,000 | $31,612 |
| 2014 | $1,236 | $41,612 | $0 | $0 |
Source: Public Records
Map
Nearby Homes
- 808 Riverview Dr SE Unit 808
- 4056 Columns Dr SE Unit 5B
- 1406 Riverview Dr SE Unit 1406
- 5626 River Heights Crossing SE
- 4001 Riverlook Pkwy SE Unit 203
- 5638 River Heights Crossing SE
- 4081 Riverlook Pkwy SE Unit 13
- 4081 Riverlook Pkwy SE Unit 102
- 4094 Columns Dr SE
- 3940 Riverlook Pkwy SE Unit 103
- 670 River Chase Point NW
- 6305 River Chase Cir NW
- 3648 Sope Creek Farm SE
- 6370 River Chase Cir NW
- 405 Ferry Landing
- 847 Farley Mill SE
- 5715 Winterthur Ln
- 600 River Chase Ridge NW
- 511 Pine Valley Rd SE
- 304 Riverview Dr SE Unit 304
- 307 Riverview Dr SE Unit 307
- 304 Riverview Dr SE
- 302 Riverview Dr SE
- 308 Riverview Dr SE
- 306 Riverview Dr SE
- 305 Riverview Dr SE
- 301 Riverview Dr SE Unit 301
- 0 Riverview Dr
- 205 Riverview Dr SE Unit 2
- 201 Riverview Dr SE Unit 201
- 205 Riverview Dr SE Unit 205
- 208 Riverview Dr SE
- 207 Riverview Dr SE
- 205 Riverview Dr SE
- 204 Riverview Dr SE Unit 204
- 203 Riverview Dr SE
- 201 Riverview Dr SE
- 201 Riverview Dr SE
- 402 Riverview Dr SE Unit 4