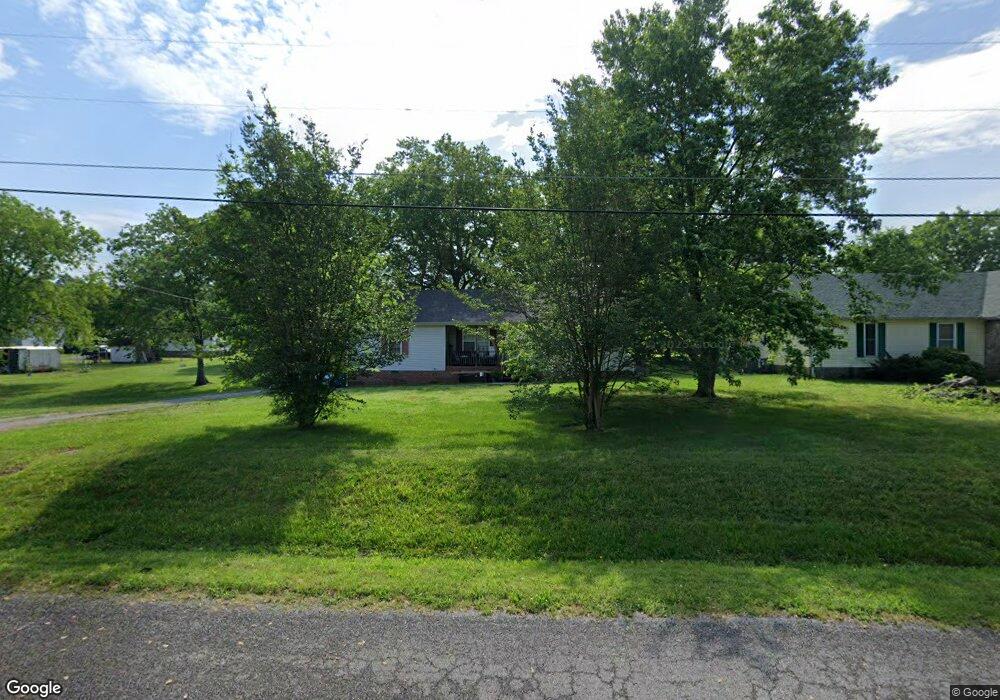
303 Tyne Rd Shelbyville, TN 37160
Estimated Value: $256,000 - $306,000
--
Bed
2
Baths
1,392
Sq Ft
$198/Sq Ft
Est. Value
About This Home
This home is located at 303 Tyne Rd, Shelbyville, TN 37160 and is currently estimated at $275,243, approximately $197 per square foot. 303 Tyne Rd is a home located in Bedford County with nearby schools including South Side Elementary School, Harris Middle School, and Christian Chapel Academy.
Ownership History
Date
Name
Owned For
Owner Type
Purchase Details
Closed on
Feb 16, 1999
Sold by
Walker Forrest Lee
Bought by
Broadway Terry A and Broadway Tracy D
Current Estimated Value
Home Financials for this Owner
Home Financials are based on the most recent Mortgage that was taken out on this home.
Original Mortgage
$78,200
Outstanding Balance
$18,263
Interest Rate
6.84%
Estimated Equity
$256,980
Purchase Details
Closed on
Jun 26, 1997
Bought by
Walker Forrest Lee Jr & %Trans Financial Mort
Purchase Details
Closed on
Nov 18, 1996
Sold by
Smith Claude Wayne
Bought by
Ledlow Robert and Ledlow Larua
Purchase Details
Closed on
Oct 4, 1990
Bought by
Smith Claude Wayne and Cherry Ann
Purchase Details
Closed on
Jul 18, 1990
Bought by
Cavalry Banking Federal Savings & Loan A
Purchase Details
Closed on
Mar 12, 1988
Bought by
Peels John L and Annie Mai
Purchase Details
Closed on
Dec 9, 1986
Bought by
Peels John L and Annie Mai
Create a Home Valuation Report for This Property
The Home Valuation Report is an in-depth analysis detailing your home's value as well as a comparison with similar homes in the area
Home Values in the Area
Average Home Value in this Area
Purchase History
| Date | Buyer | Sale Price | Title Company |
|---|---|---|---|
| Broadway Terry A | $79,200 | -- | |
| Walker Forrest Lee Jr & %Trans Financial Mort | $74,500 | -- | |
| Ledlow Robert | $10,000 | -- | |
| Smith Claude Wayne | $3,800 | -- | |
| Cavalry Banking Federal Savings & Loan A | -- | -- | |
| Peels John L | -- | -- | |
| Peels John L | -- | -- |
Source: Public Records
Mortgage History
| Date | Status | Borrower | Loan Amount |
|---|---|---|---|
| Open | Peels John L | $78,200 |
Source: Public Records
Tax History Compared to Growth
Tax History
| Year | Tax Paid | Tax Assessment Tax Assessment Total Assessment is a certain percentage of the fair market value that is determined by local assessors to be the total taxable value of land and additions on the property. | Land | Improvement |
|---|---|---|---|---|
| 2025 | -- | $40,550 | $0 | $0 |
| 2024 | -- | $40,550 | $12,500 | $28,050 |
| 2023 | $1,543 | $40,550 | $12,500 | $28,050 |
| 2022 | $1,588 | $40,550 | $12,500 | $28,050 |
| 2021 | $1,442 | $40,550 | $12,500 | $28,050 |
| 2020 | $1,059 | $40,550 | $12,500 | $28,050 |
| 2019 | $1,059 | $23,925 | $5,250 | $18,675 |
| 2018 | $1,035 | $23,925 | $5,250 | $18,675 |
| 2017 | $1,035 | $23,925 | $5,250 | $18,675 |
| 2016 | $1,026 | $23,925 | $5,250 | $18,675 |
| 2015 | $1,026 | $23,925 | $5,250 | $18,675 |
| 2014 | $907 | $23,138 | $0 | $0 |
Source: Public Records
Map
Nearby Homes