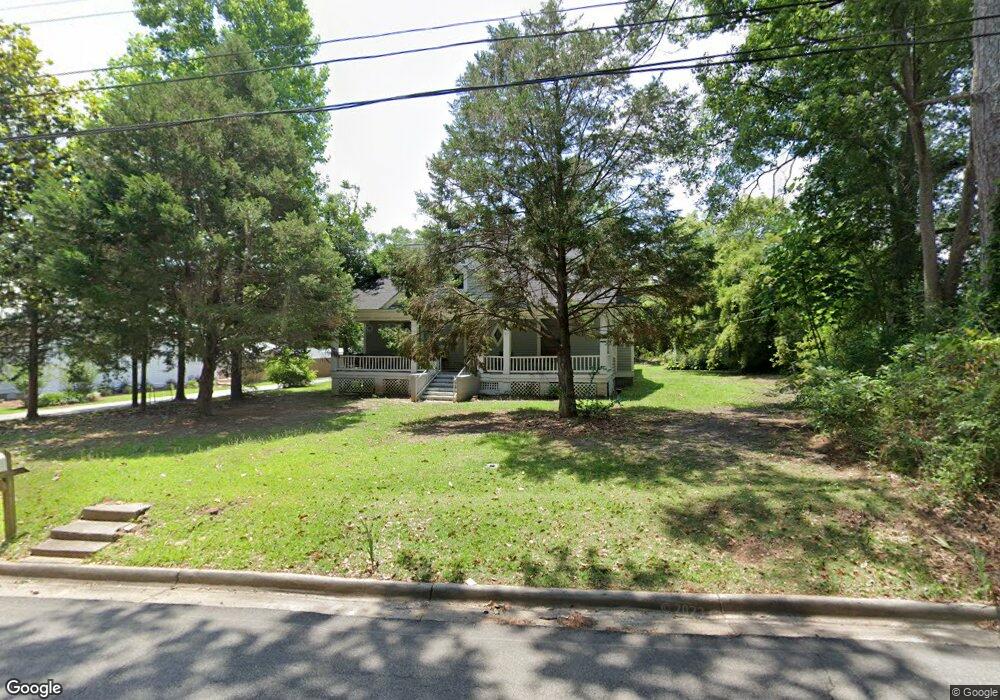
303 W Jefferson St Boston, GA 31626
Estimated Value: $168,514 - $271,000
--
Bed
--
Bath
2,480
Sq Ft
$88/Sq Ft
Est. Value
About This Home
This home is located at 303 W Jefferson St, Boston, GA 31626 and is currently estimated at $218,379, approximately $88 per square foot. 303 W Jefferson St is a home with nearby schools including Hand in Hand Primary School, Garrison-Pilcher Elementary School, and Cross Creek Elementary School.
Ownership History
Date
Name
Owned For
Owner Type
Purchase Details
Closed on
Sep 23, 2022
Sold by
Sewell Vonetta
Bought by
Sewell Rodney D and 2022 Sewell Family Trust
Current Estimated Value
Purchase Details
Closed on
May 24, 2012
Sold by
Johnson Mary B
Bought by
Peters Brian A
Purchase Details
Closed on
Jun 29, 1998
Bought by
Johnson Mary B
Purchase Details
Closed on
Mar 4, 1997
Sold by
Williams Ben
Bought by
Johnson Mary B
Create a Home Valuation Report for This Property
The Home Valuation Report is an in-depth analysis detailing your home's value as well as a comparison with similar homes in the area
Home Values in the Area
Average Home Value in this Area
Purchase History
| Date | Buyer | Sale Price | Title Company |
|---|---|---|---|
| Sewell Rodney D | -- | -- | |
| Peters Brian A | $9,500 | -- | |
| Sewell Vonetta | $17,000 | -- | |
| Johnson Mary B | $59,900 | -- | |
| Johnson Mary B | -- | -- |
Source: Public Records
Tax History Compared to Growth
Tax History
| Year | Tax Paid | Tax Assessment Tax Assessment Total Assessment is a certain percentage of the fair market value that is determined by local assessors to be the total taxable value of land and additions on the property. | Land | Improvement |
|---|---|---|---|---|
| 2024 | $1,566 | $48,518 | $3,502 | $45,016 |
| 2023 | $1,113 | $34,991 | $3,502 | $31,489 |
| 2022 | $734 | $30,413 | $2,627 | $27,786 |
| 2021 | $714 | $27,043 | $2,626 | $24,417 |
| 2020 | $718 | $26,575 | $2,627 | $23,948 |
| 2019 | $722 | $26,575 | $2,627 | $23,948 |
| 2018 | $742 | $27,097 | $2,627 | $24,470 |
| 2017 | $754 | $27,125 | $2,338 | $24,787 |
| 2016 | $762 | $27,352 | $2,338 | $25,014 |
| 2015 | $898 | $31,922 | $2,180 | $29,742 |
| 2014 | $883 | $31,210 | $2,180 | $29,029 |
| 2013 | -- | $31,209 | $2,180 | $29,029 |
Source: Public Records
Map
Nearby Homes
- 130 E Adams St
- 682 Salem Rd
- 146 Old Highway 84 W
- 185 Community Ln
- 2815 Parker Rd
- 9900 Ozell Rd
- 4311 Ozell Rd
- 431 Dry Lake Rd
- 00 Summer Hill Rd Unit 1
- 842 Crabapple Dr
- 2156 County Road 78
- 2818 Dry Lake Rd
- 00 Cone Road & Beulah Church Rd
- 454 Fox Meadow Ln
- 7402 Coffee Rd
- 233 Fox Meadow Ln
- 138
- 7500 U S 19
- 112 Henry's Rd
- 1333 Gatlin Creek Rd
- 237 W Jefferson St
- 311 Jefferson St
- 304 W Jefferson St
- 312 W Jefferson St
- 203 Cemetery St
- 231 W Jefferson St
- 238 W Jefferson St
- 420 W Jefferson St
- 221 W Jefferson St
- 438 W Jefferson St
- 439 W Jefferson St
- 129 N Cemetery St
- 214 W Jefferson St
- 135 N Cemetery St
- 203 W Jefferson St
- 449 W Jefferson St
- 122 S Norton St
- 132 S Norton St
- 0 Jefferson St
- 417 W Railroad Ave