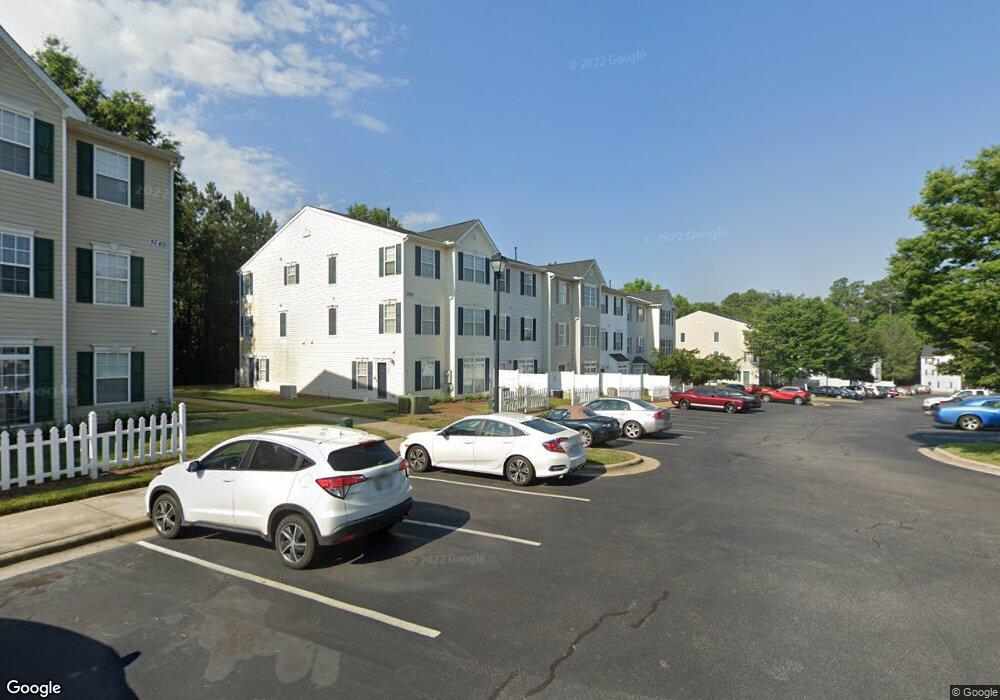
3030 Barrymore St Unit 110 Raleigh, NC 27603
South Raleigh NeighborhoodEstimated Value: $288,000 - $299,935
3
Beds
2
Baths
1,610
Sq Ft
$183/Sq Ft
Est. Value
About This Home
This home is located at 3030 Barrymore St Unit 110, Raleigh, NC 27603 and is currently estimated at $294,984, approximately $183 per square foot. 3030 Barrymore St Unit 110 is a home located in Wake County with nearby schools including Dillard Drive Magnet Elementary School, Dillard Drive Magnet Middle School, and Longleaf School Of The Arts.
Ownership History
Date
Name
Owned For
Owner Type
Purchase Details
Closed on
Jun 6, 2017
Sold by
Callaway Jonathan Jay and Callaway Michele A
Bought by
Rieper Shen
Current Estimated Value
Home Financials for this Owner
Home Financials are based on the most recent Mortgage that was taken out on this home.
Original Mortgage
$147,000
Outstanding Balance
$123,846
Interest Rate
4.5%
Mortgage Type
Adjustable Rate Mortgage/ARM
Estimated Equity
$171,138
Purchase Details
Closed on
Feb 22, 2008
Sold by
Ju Tae Jin and Yoon Seyi
Bought by
Callaway Jonathan Jay
Home Financials for this Owner
Home Financials are based on the most recent Mortgage that was taken out on this home.
Original Mortgage
$148,000
Interest Rate
5.85%
Mortgage Type
Purchase Money Mortgage
Purchase Details
Closed on
Jul 17, 2003
Sold by
Camden Crossing Townhomes Llc
Bought by
Ju Tae Jin
Home Financials for this Owner
Home Financials are based on the most recent Mortgage that was taken out on this home.
Original Mortgage
$135,100
Interest Rate
5.42%
Mortgage Type
FHA
Create a Home Valuation Report for This Property
The Home Valuation Report is an in-depth analysis detailing your home's value as well as a comparison with similar homes in the area
Home Values in the Area
Average Home Value in this Area
Purchase History
| Date | Buyer | Sale Price | Title Company |
|---|---|---|---|
| Rieper Shen | $145,000 | None Available | |
| Callaway Jonathan Jay | $149,500 | None Available | |
| Ju Tae Jin | $139,000 | -- |
Source: Public Records
Mortgage History
| Date | Status | Borrower | Loan Amount |
|---|---|---|---|
| Open | Rieper Shen | $147,000 | |
| Previous Owner | Callaway Jonathan Jay | $148,000 | |
| Previous Owner | Ju Tae Jin | $135,100 |
Source: Public Records
Tax History Compared to Growth
Tax History
| Year | Tax Paid | Tax Assessment Tax Assessment Total Assessment is a certain percentage of the fair market value that is determined by local assessors to be the total taxable value of land and additions on the property. | Land | Improvement |
|---|---|---|---|---|
| 2025 | $2,449 | $278,567 | -- | $278,567 |
| 2024 | $2,439 | $278,567 | $0 | $278,567 |
| 2023 | $1,991 | $184,725 | $0 | $184,725 |
| 2022 | $1,851 | $184,725 | $0 | $184,725 |
| 2021 | $1,817 | $184,725 | $0 | $184,725 |
| 2020 | $1,784 | $184,725 | $0 | $184,725 |
| 2019 | $1,586 | $135,105 | $0 | $135,105 |
| 2018 | $1,496 | $135,105 | $0 | $135,105 |
| 2017 | $1,426 | $135,105 | $0 | $135,105 |
| 2016 | $1,396 | $135,105 | $0 | $135,105 |
| 2015 | $1,571 | $149,791 | $0 | $149,791 |
| 2014 | $1,491 | $149,791 | $0 | $149,791 |
Source: Public Records
Map
Nearby Homes
- 2621 Ivory Run Way Unit 105
- 2831 Barrymore St Unit 107
- 2524 Ferndown Ct
- 3109 Tryon Rd
- 3113 Tryon Rd
- 3115 Tryon Rd
- 2920 Barrymore St Unit 106
- 2505 Ferndown Ct
- 2901 Alder Ridge Ln
- 2708 Sadie Hopkins St
- 2816 Alder Ridge Ln
- 2528 Beech Gap Ct
- 2108 Leadenhall Way
- 3223 Tryon Rd
- 2221 Mountain Mist Ct Unit 201
- 2201 Mountain Mist Ct Unit 103
- 2639 Broad Oaks Place Unit 21
- 2607 Sterling Park Dr
- 1901 Trailwood Heights Ln Unit 304
- 2271 Trailwood Valley Cir
- 3030 Barrymore St Unit 111
- 3030 Barrymore St Unit 109
- 3030 Barrymore St Unit 108
- 3030 Barrymore St Unit 107
- 3030 Barrymore St Unit 106
- 3030 Barrymore St Unit 105
- 3030 Barrymore St Unit 104
- 3030 Barrymore St Unit 103
- 3030 Barrymore St Unit 102
- 3030 Barrymore St Unit 101
- 3030 Barrymore St Unit 100
- 3030 Barrymore St
- 3201 Barrymore St Unit 101
- 3040 Barrymore St Unit 111
- 3040 Barrymore St Unit 110
- 3040 Barrymore St Unit 109
- 3040 Barrymore St Unit 108
- 3040 Barrymore St Unit 107
- 3040 Barrymore St Unit 106
- 3040 Barrymore St Unit 105