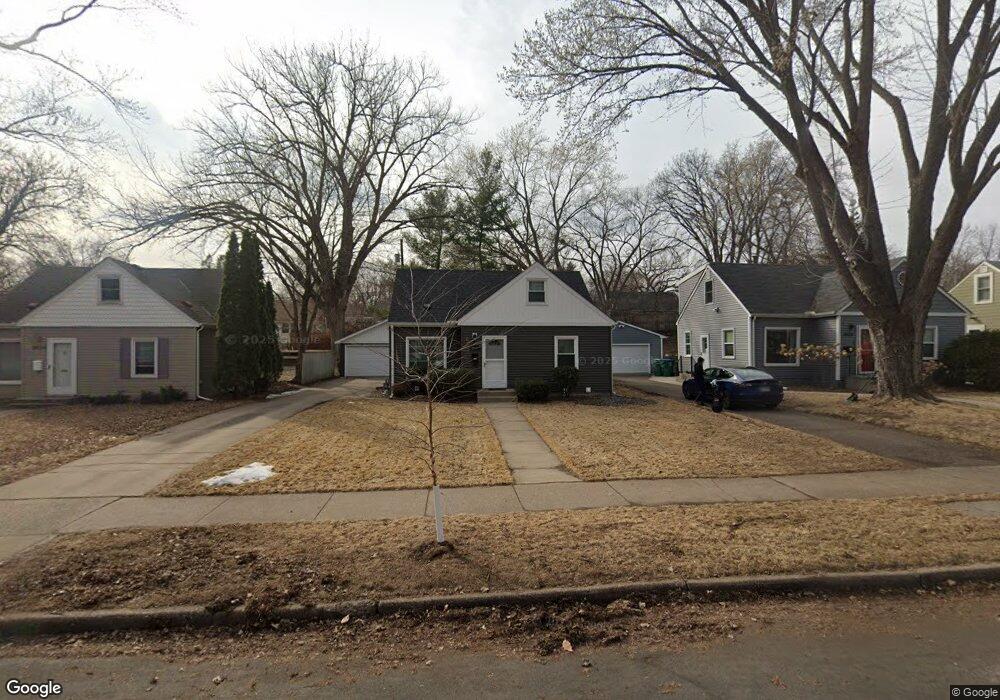
3030 Pennsylvania Ave S Saint Louis Park, MN 55426
Oak Hill NeighborhoodEstimated Value: $385,000 - $429,000
3
Beds
2
Baths
1,727
Sq Ft
$232/Sq Ft
Est. Value
About This Home
This home is close to everything (West End, Downtown, Uptown, airport, etc). It is located in a quiet neighborhood in St. Louis Park. The home features 3br, 2 ba, 2 car with updated kitchen including granite counters and stainless steel appliances.
Tenant pays all utilities including city water/trash bill. Tenant takes care of mowing, landscaping and snow removal.
Must make 3x monthly rent in income, pets negotiable.
18-24 month lease preferred. Must make 3x monthly rent in income.
Ownership History
Date
Name
Owned For
Owner Type
Purchase Details
Closed on
Oct 13, 2025
Sold by
E A Investments Inc
Bought by
Isun Equities Inc
Current Estimated Value
Purchase Details
Closed on
Aug 25, 2006
Sold by
Neuenfeldt Joseph J
Bought by
Mcdunn Jason
Purchase Details
Closed on
Jun 10, 2002
Sold by
Friese Brian J
Bought by
Stoffal Robin J and Neuenfeldt Joseph J
Purchase Details
Closed on
May 28, 1998
Sold by
Mcmullen Tim E
Bought by
Friese Brian J and Kassebaum Amy L
Create a Home Valuation Report for This Property
The Home Valuation Report is an in-depth analysis detailing your home's value as well as a comparison with similar homes in the area
Home Values in the Area
Average Home Value in this Area
Purchase History
| Date | Buyer | Sale Price | Title Company |
|---|---|---|---|
| Isun Equities Inc | $500 | None Listed On Document | |
| Mcdunn Jason | $252,000 | -- | |
| Stoffal Robin J | $203,500 | -- | |
| Friese Brian J | $121,000 | -- |
Source: Public Records
Property History
| Date | Event | Price | List to Sale | Price per Sq Ft |
|---|---|---|---|---|
| 11/07/2024 11/07/24 | Off Market | $2,450 | -- | -- |
| 10/11/2024 10/11/24 | Price Changed | $2,450 | -7.5% | $1 / Sq Ft |
| 10/08/2024 10/08/24 | Off Market | $2,650 | -- | -- |
| 09/28/2024 09/28/24 | For Rent | $2,650 | 0.0% | -- |
| 09/23/2024 09/23/24 | Price Changed | $2,650 | -1.9% | $2 / Sq Ft |
| 09/20/2024 09/20/24 | Price Changed | $2,700 | -3.6% | $2 / Sq Ft |
| 09/01/2024 09/01/24 | For Rent | $2,800 | -- | -- |
Tax History Compared to Growth
Tax History
| Year | Tax Paid | Tax Assessment Tax Assessment Total Assessment is a certain percentage of the fair market value that is determined by local assessors to be the total taxable value of land and additions on the property. | Land | Improvement |
|---|---|---|---|---|
| 2024 | $5,028 | $358,300 | $132,500 | $225,800 |
| 2023 | $4,502 | $337,800 | $132,500 | $205,300 |
| 2022 | $4,327 | $352,600 | $131,900 | $220,700 |
| 2021 | $3,919 | $323,100 | $114,700 | $208,400 |
| 2020 | $3,785 | $295,400 | $109,300 | $186,100 |
| 2019 | $3,536 | $273,800 | $104,100 | $169,700 |
| 2018 | $3,565 | $246,800 | $99,200 | $147,600 |
| 2017 | $3,330 | $216,500 | $78,500 | $138,000 |
| 2016 | $3,189 | $213,600 | $70,900 | $142,700 |
| 2015 | $2,977 | $193,500 | $66,300 | $127,200 |
| 2014 | -- | $176,000 | $62,900 | $113,100 |
Source: Public Records
Map
Nearby Homes
- 3101 Sumter Ave S
- 3101 Nevada Ave S
- 3124 Maryland Ave S
- 3149 Nevada Ave S
- 3153 Nevada Ave S
- 7217 Minnetonka Blvd
- 2841 Texas Ave S
- 3216 Kentucky Ave S
- 2819 Virginia Ave S
- 8200 W 33rd St Unit 208
- 8200 W 33rd St Unit 222
- 8200 W 33rd St Unit 305
- 3200 Virginia Ave S Unit 209
- 3320 Louisiana Ave S Unit 311
- 3320 Louisiana Ave S Unit 410
- 3320 Louisiana Ave S Unit 310
- 3320 Louisiana Ave S Unit 112
- 3300 Louisiana Ave S Unit 517
- 3320 Louisiana Ave S Unit 106
- 3300 Louisiana Ave S Unit 422
- 3034 Pennsylvania Ave S
- 3024 Pennsylvania Ave S
- 3034 Pennsylvania Ave S
- 3030 3030 Pennsylvania-Avenue-s
- 3020 Pennsylvania Ave S
- 3033 3033 Pennsylvania-Avenue-s
- 3033 3033 Pennsylvania Ave S
- 3042 Pennsylvania Ave S
- 3031 Quebec Ave S
- 3035 Quebec Ave S
- 3042 3042 Pennsylvania Ave S
- 3041 Quebec Ave S
- 3025 Quebec Ave S
- 3014 Pennsylvania Ave S
- 3048 Pennsylvania Ave S
- 3014 3014 Pennsylvania Ave S
- 3045 Pennsylvania Ave S
- 3045 Quebec Ave S
- 3041 Pennsylvania Ave S
- 3033 Pennsylvania Ave S