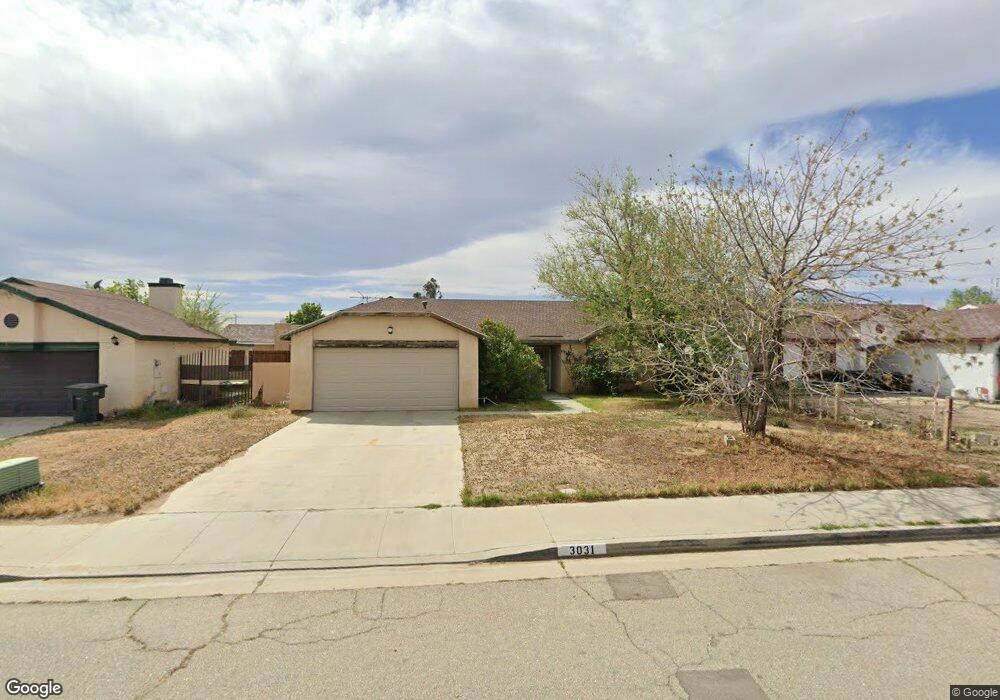
3031 Gertrude St Rosamond, CA 93560
Estimated Value: $285,000 - $365,000
3
Beds
2
Baths
1,231
Sq Ft
$272/Sq Ft
Est. Value
About This Home
This home is located at 3031 Gertrude St, Rosamond, CA 93560 and is currently estimated at $334,983, approximately $272 per square foot. 3031 Gertrude St is a home located in Kern County.
Ownership History
Date
Name
Owned For
Owner Type
Purchase Details
Closed on
Jan 19, 2023
Sold by
Sutter Carl
Bought by
Carl Sutter 2023 Trust
Current Estimated Value
Purchase Details
Closed on
Sep 29, 2000
Sold by
Mulalley Christina
Bought by
Sutter Carl F and Sutter Cindy I
Home Financials for this Owner
Home Financials are based on the most recent Mortgage that was taken out on this home.
Original Mortgage
$58,053
Interest Rate
8.01%
Mortgage Type
FHA
Purchase Details
Closed on
Aug 14, 1997
Sold by
Hud
Bought by
Sutter Carl F and Sutter Cindy I
Home Financials for this Owner
Home Financials are based on the most recent Mortgage that was taken out on this home.
Original Mortgage
$56,135
Interest Rate
7.43%
Mortgage Type
FHA
Purchase Details
Closed on
Jan 9, 1997
Sold by
First Mtg Corp
Bought by
Hud
Purchase Details
Closed on
Jan 7, 1997
Sold by
Monterrosa Ricardo A and Monterrosa Janet
Bought by
First Mtg Corp
Create a Home Valuation Report for This Property
The Home Valuation Report is an in-depth analysis detailing your home's value as well as a comparison with similar homes in the area
Home Values in the Area
Average Home Value in this Area
Purchase History
| Date | Buyer | Sale Price | Title Company |
|---|---|---|---|
| Carl Sutter 2023 Trust | -- | -- | |
| Sutter Carl F | -- | First American Title Co | |
| Sutter Carl F | $55,000 | American Title Co | |
| Hud | -- | First American Title Co | |
| First Mtg Corp | $84,345 | Fidelity National Title |
Source: Public Records
Mortgage History
| Date | Status | Borrower | Loan Amount |
|---|---|---|---|
| Previous Owner | Sutter Carl F | $58,053 | |
| Previous Owner | Sutter Carl F | $56,135 |
Source: Public Records
Tax History Compared to Growth
Tax History
| Year | Tax Paid | Tax Assessment Tax Assessment Total Assessment is a certain percentage of the fair market value that is determined by local assessors to be the total taxable value of land and additions on the property. | Land | Improvement |
|---|---|---|---|---|
| 2025 | $2,361 | $87,787 | $28,725 | $59,062 |
| 2024 | $2,239 | $86,066 | $28,162 | $57,904 |
| 2023 | $2,239 | $84,379 | $27,610 | $56,769 |
| 2022 | $2,114 | $82,725 | $27,069 | $55,656 |
| 2021 | $1,960 | $81,104 | $26,539 | $54,565 |
| 2020 | $1,920 | $80,273 | $26,267 | $54,006 |
| 2019 | $1,024 | $80,273 | $26,267 | $54,006 |
| 2018 | $995 | $77,158 | $25,248 | $51,910 |
| 2017 | $978 | $75,646 | $24,753 | $50,893 |
| 2016 | $935 | $74,164 | $24,268 | $49,896 |
| 2015 | $937 | $73,051 | $23,904 | $49,147 |
| 2014 | $1,350 | $71,621 | $23,436 | $48,185 |
Source: Public Records
Map
Nearby Homes
- 3025 Melvin St
- 3112 Edwards Ave
- 3125 Richland Ave
- 3237 Shady Vista Ln
- 0
- 0 Marielle Parcel 3 Way
- 0 Marielle Way Parcel 2
- 3407 Amber St
- 3331 Kellie Ave
- 3437 Jaguar Ct
- 3325 Poplar St
- 3393 Stella Ave
- 3387 Stella Ave
- 3394 Stella Ave
- 3708 Santa Ynez Ct
- 3700 Santa Ynez Ct
- 3440 Citrine Ln
- 3525 San Jacinto Ave
- 3600 Gold Stone Ln
- 3524 San Jacinto Ave
- 3025 Gertrude St
- 3037 Gertrude St
- 3030 Melvin St
- 3019 Gertrude St
- 3101 Gertrude St
- 3024 Melvin St
- 3036 Melvin St
- 3018 Melvin St Unit A
- 3100 Melvin St
- 3030 Gertrude St
- 3024 Gertrude St
- 3036 Gertrude St
- 3107 Gertrude St
- 3013 Gertrude St
- 3012 Melvin St
- 3100 Gertrude St
- 3018 Gertrude St
- 3106 Melvin St Unit A
- 3106 Gertrude St
- 3012 Gertrude St