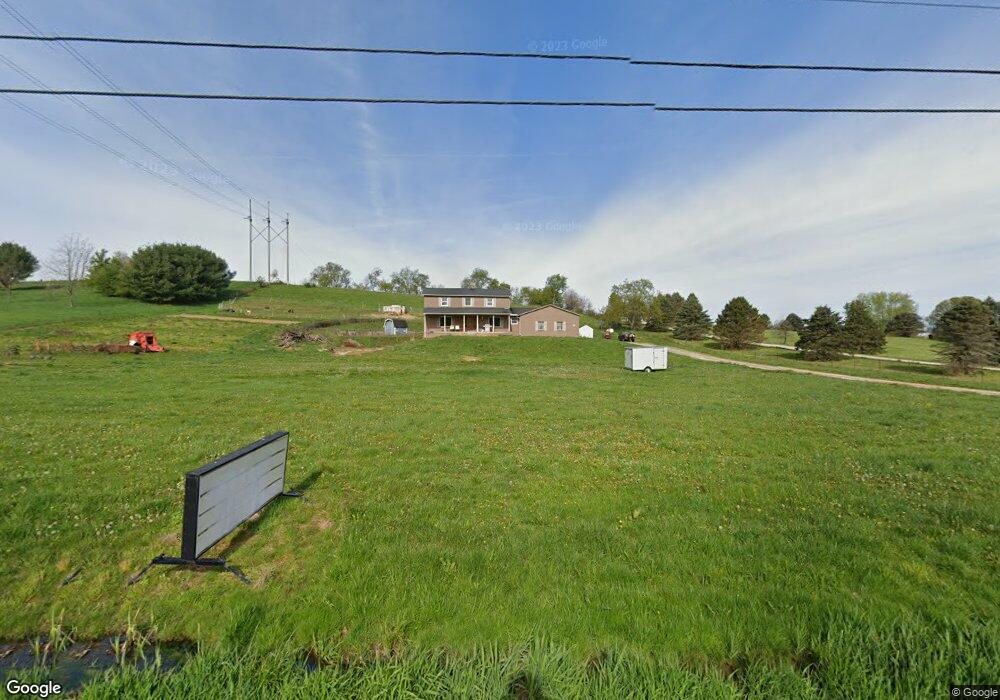
3033 Dayton Rd NE Newark, OH 43055
Madison NeighborhoodEstimated Value: $448,000 - $540,000
6
Beds
4
Baths
2,224
Sq Ft
$225/Sq Ft
Est. Value
About This Home
This home is located at 3033 Dayton Rd NE, Newark, OH 43055 and is currently estimated at $500,886, approximately $225 per square foot. 3033 Dayton Rd NE is a home located in Licking County with nearby schools including Licking Valley Elementary School, Licking Valley Middle School, and Licking Valley High School.
Ownership History
Date
Name
Owned For
Owner Type
Purchase Details
Closed on
Aug 28, 2006
Sold by
Bibart Thomas E and Bibart Deborah J
Bought by
Davidson Rodney S and Fenner Wendy L
Current Estimated Value
Home Financials for this Owner
Home Financials are based on the most recent Mortgage that was taken out on this home.
Original Mortgage
$160,000
Outstanding Balance
$97,181
Interest Rate
6.88%
Mortgage Type
Unknown
Estimated Equity
$403,705
Purchase Details
Closed on
Dec 1, 1999
Sold by
Hummel Philip W
Bought by
Bibart Thomas E and Bibart Deborah J
Home Financials for this Owner
Home Financials are based on the most recent Mortgage that was taken out on this home.
Original Mortgage
$275,200
Interest Rate
7.97%
Mortgage Type
New Conventional
Purchase Details
Closed on
Jul 29, 1996
Sold by
Hummell Philip W
Bought by
Rower Philip E and Rower Adlee E
Home Financials for this Owner
Home Financials are based on the most recent Mortgage that was taken out on this home.
Original Mortgage
$84,000
Interest Rate
8.43%
Mortgage Type
New Conventional
Create a Home Valuation Report for This Property
The Home Valuation Report is an in-depth analysis detailing your home's value as well as a comparison with similar homes in the area
Home Values in the Area
Average Home Value in this Area
Purchase History
| Date | Buyer | Sale Price | Title Company |
|---|---|---|---|
| Davidson Rodney S | $250,000 | Stewart | |
| Bibart Thomas E | $177,000 | -- | |
| Rower Philip E | $158,000 | -- |
Source: Public Records
Mortgage History
| Date | Status | Borrower | Loan Amount |
|---|---|---|---|
| Open | Davidson Rodney S | $160,000 | |
| Closed | Bibart Thomas E | $275,200 | |
| Previous Owner | Rower Philip E | $84,000 |
Source: Public Records
Tax History Compared to Growth
Tax History
| Year | Tax Paid | Tax Assessment Tax Assessment Total Assessment is a certain percentage of the fair market value that is determined by local assessors to be the total taxable value of land and additions on the property. | Land | Improvement |
|---|---|---|---|---|
| 2024 | $4,529 | $124,950 | $29,680 | $95,270 |
| 2023 | $4,659 | $124,950 | $29,680 | $95,270 |
| 2022 | $4,427 | $106,720 | $19,500 | $87,220 |
| 2021 | $4,526 | $106,720 | $19,500 | $87,220 |
| 2020 | $4,524 | $106,720 | $19,500 | $87,220 |
| 2019 | $3,402 | $82,320 | $17,710 | $64,610 |
| 2018 | $3,439 | $0 | $0 | $0 |
| 2017 | $3,601 | $0 | $0 | $0 |
| 2016 | $3,738 | $0 | $0 | $0 |
| 2015 | $3,755 | $0 | $0 | $0 |
| 2014 | $5,198 | $0 | $0 | $0 |
| 2013 | $3,731 | $0 | $0 | $0 |
Source: Public Records
Map
Nearby Homes
- 3893 Fallsburg Rd NE
- 10095 Eddyburg Rd NE
- 394 Brentwood Dr NE
- 400 Brentwood Dr NE
- 0 Stewart Rd NE
- 506 Lexington Ave
- 460 Allston Ave
- 483 Allston Ave
- 0 Swans Rd NE
- 554 Garfield Ave
- 424 Ridge Ave
- 491 Garfield Ave
- 87 Liberty Ave
- 383 Kells Ct E
- 952 Emerson St
- 240 N Wing St
- 1649 Lewie Dr
- 165 Edwards St
- 394 Saint James Gate
- 524 Wildflower Dr
- 2989 Dayton Rd NE
- 3094 Dayton Rd NE
- 2992 Dayton Rd NE
- 3039 Dayton Rd NE
- 3065 Dayton Rd NE
- 4094 Fallsburg Rd NE
- 3171 Dayton Rd NE
- 3207 Dayton Rd NE
- 2820 Dayton Rd NE
- 4258 Fallsburg Rd NE
- 4260 Fallsburg Rd NE
- 2891 Dayton Rd NE
- 3226 Dayton Rd NE
- 2849 Dayton Rd NE
- 4152 Fallsburg Rd NE
- 9330 Fallsburg Rd NE
- 0 Fallsburg Rd NE
- 3233 Dayton Rd NE
- 4075 Fallsburg Rd NE
- 2815 Dayton Rd NE