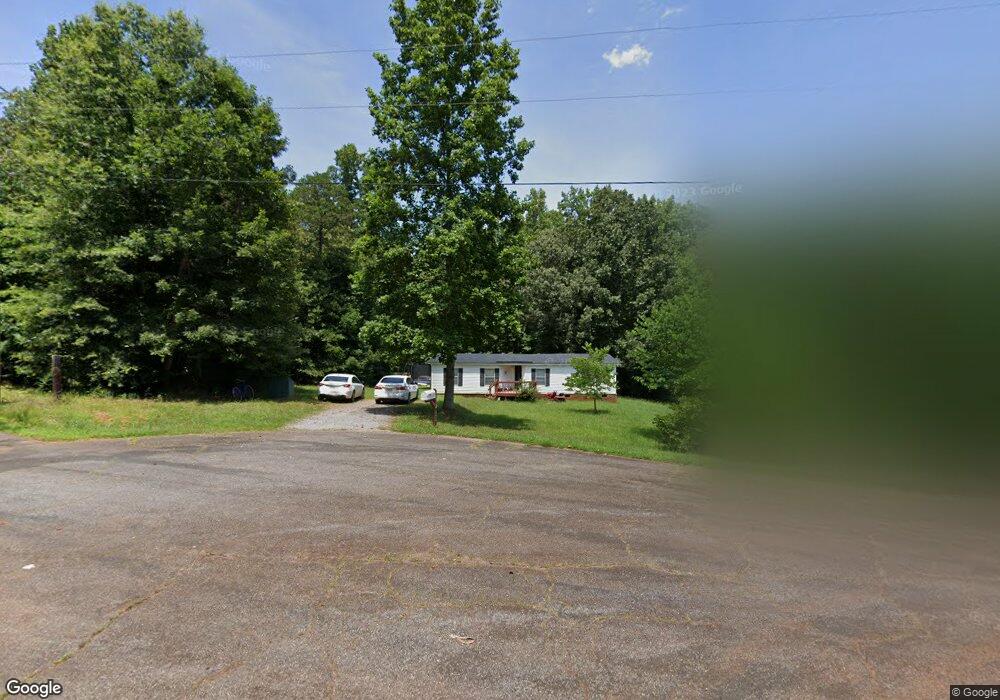
3034 Heavners Farm Ct Lincolnton, NC 28092
Estimated Value: $114,000 - $245,000
3
Beds
2
Baths
1,080
Sq Ft
$155/Sq Ft
Est. Value
About This Home
This home is located at 3034 Heavners Farm Ct, Lincolnton, NC 28092 and is currently estimated at $167,667, approximately $155 per square foot. 3034 Heavners Farm Ct is a home located in Lincoln County with nearby schools including Norris S. Childers Elementary School, West Lincoln Middle, and West Lincoln High School.
Ownership History
Date
Name
Owned For
Owner Type
Purchase Details
Closed on
Jan 8, 2020
Sold by
Safari Properties Llc
Bought by
Safari Ebed Llc
Current Estimated Value
Home Financials for this Owner
Home Financials are based on the most recent Mortgage that was taken out on this home.
Original Mortgage
$146,000
Interest Rate
2.7%
Mortgage Type
Purchase Money Mortgage
Purchase Details
Closed on
Jun 8, 2018
Sold by
Sides Richard D and Sides Betty S
Bought by
Safari Properties Llc
Purchase Details
Closed on
Dec 18, 2006
Sold by
Smith Sandra
Bought by
Sides Richard D and Sides Betty S
Purchase Details
Closed on
Nov 4, 2004
Bought by
Smith Sandra
Purchase Details
Closed on
May 3, 2002
Bought by
Martin Bruce W and Martin Dawn L
Purchase Details
Closed on
Mar 31, 1999
Bought by
Carswell Ronny G and Carswell Betty F
Purchase Details
Closed on
Dec 3, 1997
Bought by
King Jeffrey Lee and Cynthia Barnes
Create a Home Valuation Report for This Property
The Home Valuation Report is an in-depth analysis detailing your home's value as well as a comparison with similar homes in the area
Home Values in the Area
Average Home Value in this Area
Purchase History
| Date | Buyer | Sale Price | Title Company |
|---|---|---|---|
| Safari Ebed Llc | $150,000 | None Available | |
| Safari Properties Llc | -- | None Available | |
| Sides Richard D | $30,000 | None Available | |
| Smith Sandra | $48,000 | -- | |
| Martin Bruce W | $50,000 | -- | |
| Carswell Ronny G | $54,000 | -- | |
| King Jeffrey Lee | $52,500 | -- |
Source: Public Records
Mortgage History
| Date | Status | Borrower | Loan Amount |
|---|---|---|---|
| Previous Owner | Safari Ebed Llc | $146,000 |
Source: Public Records
Tax History Compared to Growth
Tax History
| Year | Tax Paid | Tax Assessment Tax Assessment Total Assessment is a certain percentage of the fair market value that is determined by local assessors to be the total taxable value of land and additions on the property. | Land | Improvement |
|---|---|---|---|---|
| 2025 | $782 | $101,112 | $28,000 | $73,112 |
| 2024 | $762 | $101,112 | $28,000 | $73,112 |
| 2023 | $757 | $101,112 | $28,000 | $73,112 |
| 2022 | $621 | $67,067 | $23,000 | $44,067 |
| 2021 | $621 | $67,067 | $23,000 | $44,067 |
| 2020 | $493 | $67,067 | $23,000 | $44,067 |
| 2019 | $493 | $67,067 | $23,000 | $44,067 |
| 2018 | $531 | $58,615 | $20,500 | $38,115 |
| 2017 | $430 | $58,615 | $20,500 | $38,115 |
| 2016 | $430 | $58,615 | $20,500 | $38,115 |
| 2015 | $506 | $58,615 | $20,500 | $38,115 |
| 2014 | $520 | $62,279 | $20,500 | $41,779 |
Source: Public Records
Map
Nearby Homes
- 142 Alf Hoover Rd
- 1000 Creekside Dr
- 938 Lyndsey Brook Ct
- 1084 Lyndsey Brook Ct
- 3300 Paul Heavner Ln
- 1074 Lyndsey Brook Ct
- 2508 Rock Dam Rd
- 2383 N Carolina 182
- 963 Sunbeam Dr
- 3103 Richview Dr
- 1357 Malden Ct
- 1495 Leonards Fork Church Rd
- 2700 Moose Gantt Trail
- 00 Pleasant Grove Church Rd
- 00 George Brown Rd Unit 10
- 00 George Brown Rd Unit 9
- 00 George Brown Rd Unit 8
- 00 George Brown Rd Unit 7
- 00 George Brown Rd Unit 6
- 00 George Brown Rd Unit 5
- 3018 Heavners Farm Ct
- 3004 Heavners Farm Ct
- 3040 Heavners Farm Ct
- 3033 Heavners Farm Ct
- 3007 Heavners Farm Ct
- 3021 Heavners Farm Ct
- 386 Franks Rd
- 2976 Heavners Farm Ct
- 402 Franks Rd
- 2962 Heavners Farm Ct
- 3340 Harmon Rd
- 383 Franks Rd
- 414 Franks Rd
- 401 Franks Rd
- 2948 Heavners Farm Ct
- 426 Franks Rd
- 413 Franks Rd
- 438 Franks Rd
- 2947 Heavners Farm Ct
- 2947 Heavners Farm Ct Unit 15