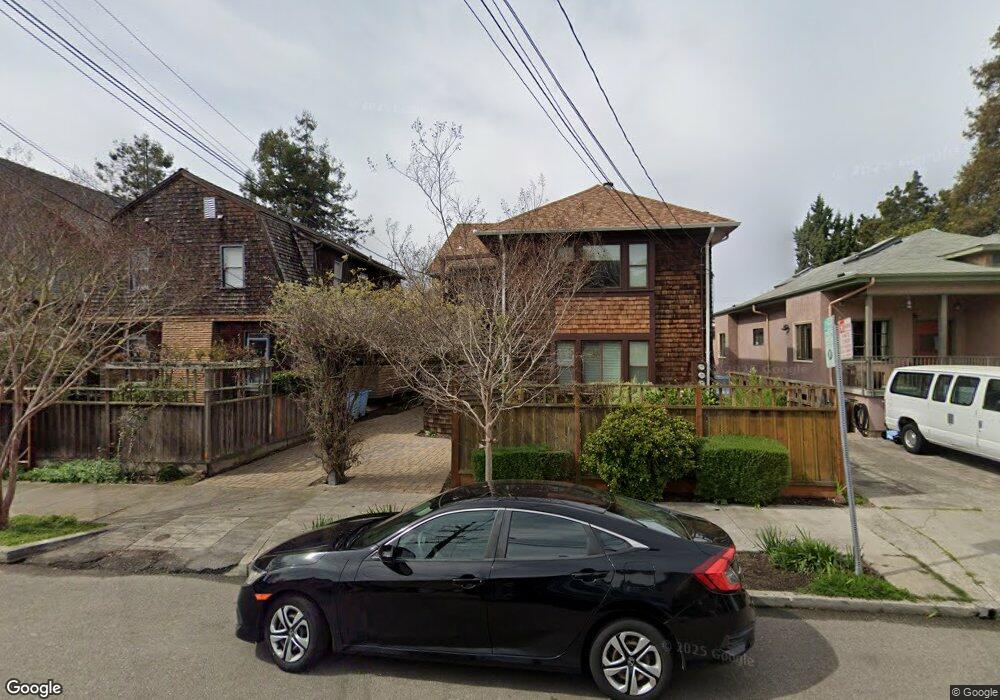
3036 Fulton St Unit B Berkeley, CA 94705
South Berkeley NeighborhoodEstimated Value: $704,029 - $971,000
2
Beds
1
Bath
1,028
Sq Ft
$835/Sq Ft
Est. Value
About This Home
This home is located at 3036 Fulton St Unit B, Berkeley, CA 94705 and is currently estimated at $858,007, approximately $834 per square foot. 3036 Fulton St Unit B is a home located in Alameda County with nearby schools including Malcolm X Elementary School, Emerson Elementary School, and John Muir Elementary School.
Ownership History
Date
Name
Owned For
Owner Type
Purchase Details
Closed on
Feb 3, 2016
Sold by
Kirk Deborah
Bought by
Kirk Deborah
Current Estimated Value
Purchase Details
Closed on
Dec 6, 2012
Sold by
Kirk Deborh
Bought by
Kirk Deborah
Home Financials for this Owner
Home Financials are based on the most recent Mortgage that was taken out on this home.
Original Mortgage
$273,000
Outstanding Balance
$188,251
Interest Rate
3.27%
Mortgage Type
New Conventional
Estimated Equity
$669,756
Purchase Details
Closed on
Jul 8, 2009
Sold by
Schapiro Mark
Bought by
Kirk Deborah
Home Financials for this Owner
Home Financials are based on the most recent Mortgage that was taken out on this home.
Original Mortgage
$280,000
Interest Rate
5.25%
Mortgage Type
Purchase Money Mortgage
Purchase Details
Closed on
Jun 21, 2005
Sold by
Olsen Martin and Olsen Eric M
Bought by
Amos Audrey
Home Financials for this Owner
Home Financials are based on the most recent Mortgage that was taken out on this home.
Original Mortgage
$488,000
Interest Rate
1%
Mortgage Type
Negative Amortization
Purchase Details
Closed on
Mar 8, 2002
Sold by
Olsen Betty M
Bought by
Olsen Martin and Olsen Eric M
Purchase Details
Closed on
Sep 12, 2001
Sold by
Olsen Kathryn Ann
Bought by
Olsen Eric Martin
Home Financials for this Owner
Home Financials are based on the most recent Mortgage that was taken out on this home.
Original Mortgage
$160,000
Interest Rate
6.57%
Mortgage Type
Purchase Money Mortgage
Purchase Details
Closed on
Aug 9, 2001
Sold by
Olsen Eric M
Bought by
Olsen Eric M and Olsen Martin G
Home Financials for this Owner
Home Financials are based on the most recent Mortgage that was taken out on this home.
Original Mortgage
$160,000
Interest Rate
6.57%
Mortgage Type
Purchase Money Mortgage
Purchase Details
Closed on
Aug 21, 2000
Sold by
Armstrong Gregory and Armstrong Sharon S
Bought by
Olsen Eric M and Olsen Kathryn A
Home Financials for this Owner
Home Financials are based on the most recent Mortgage that was taken out on this home.
Original Mortgage
$167,000
Interest Rate
8.15%
Mortgage Type
Purchase Money Mortgage
Purchase Details
Closed on
Jan 8, 1999
Sold by
Mcqueen David A and Mcqueen Gregory
Bought by
Armstrong Gregory and Armstrong Sharon S
Home Financials for this Owner
Home Financials are based on the most recent Mortgage that was taken out on this home.
Original Mortgage
$112,600
Interest Rate
6.63%
Mortgage Type
Purchase Money Mortgage
Purchase Details
Closed on
Aug 6, 1996
Sold by
Crofton Ralph L
Bought by
Lafrance Helene
Create a Home Valuation Report for This Property
The Home Valuation Report is an in-depth analysis detailing your home's value as well as a comparison with similar homes in the area
Home Values in the Area
Average Home Value in this Area
Purchase History
| Date | Buyer | Sale Price | Title Company |
|---|---|---|---|
| Kirk Deborah | -- | None Available | |
| Kirk Deborah | -- | None Available | |
| Kirk Deborah | -- | Chicago Title Company | |
| Kirk Deborah | $380,000 | Chicago Title Company | |
| Amos Audrey | $610,000 | Fidelity National Title | |
| Olsen Martin | -- | -- | |
| Olsen Eric Martin | -- | -- | |
| Olsen Eric M | $107,000 | Old Republic Title Company | |
| Olsen Eric M | -- | Old Republic Title Company | |
| Olsen Eric M | $247,000 | Old Republic Title Company | |
| Armstrong Gregory | -- | Placer Title Company | |
| Lafrance Helene | -- | Placer Title Company |
Source: Public Records
Mortgage History
| Date | Status | Borrower | Loan Amount |
|---|---|---|---|
| Open | Kirk Deborah | $273,000 | |
| Closed | Kirk Deborah | $280,000 | |
| Previous Owner | Amos Audrey | $488,000 | |
| Previous Owner | Olsen Eric M | $160,000 | |
| Previous Owner | Olsen Eric M | $167,000 | |
| Previous Owner | Armstrong Gregory | $112,600 |
Source: Public Records
Tax History
| Year | Tax Paid | Tax Assessment Tax Assessment Total Assessment is a certain percentage of the fair market value that is determined by local assessors to be the total taxable value of land and additions on the property. | Land | Improvement |
|---|---|---|---|---|
| 2025 | $7,926 | $483,477 | $147,143 | $343,334 |
| 2024 | $7,926 | $473,863 | $144,259 | $336,604 |
| 2023 | $7,754 | $471,434 | $141,430 | $330,004 |
| 2022 | $7,603 | $455,193 | $138,658 | $323,535 |
| 2021 | $7,611 | $446,134 | $135,940 | $317,194 |
| 2020 | $7,184 | $448,490 | $134,547 | $313,943 |
| 2019 | $6,879 | $439,697 | $131,909 | $307,788 |
| 2018 | $6,757 | $431,078 | $129,323 | $301,755 |
| 2017 | $6,510 | $422,627 | $126,788 | $295,839 |
| 2016 | $6,282 | $414,344 | $124,303 | $290,041 |
| 2015 | $6,195 | $408,123 | $122,437 | $285,686 |
| 2014 | $6,145 | $400,131 | $120,039 | $280,092 |
Source: Public Records
Map
Nearby Homes
- 2124 Prince St
- 3046 Deakin St
- 629 66th St
- 2110 Ashby Ave
- 2923 Wheeler St
- 2057 Emerson St
- 2243 Ashby Ave
- 6445 Irwin Ct
- 6555 Shattuck Ave
- 556 Alcatraz Ave
- 667 & 667A Alcatraz Ave
- 667 Alcatraz Ave
- 6320 Shattuck Ave
- 6300 Shattuck Ave Unit 1
- 2917 Telegraph Ave
- 2935 Florence St
- 6446 Colby St
- 2477 Prince St
- 2319 Ward St
- 360 Alcatraz Ave
- 3036 Fulton St Unit C
- 3036 Fulton St Unit A
- 3034 Fulton St
- 3038 Fulton St
- 3026 Fulton St
- 3040 Fulton St
- 3024 Fulton St
- 3031 Wheeler St
- 3033 Wheeler St
- 3042 Fulton St
- 3025 Wheeler St
- 3022 Fulton St
- 3021 Wheeler St
- 3037 Wheeler St
- 3046 Fulton St
- 3041 Fulton St
- 3047 Wheeler St
- 3031 Fulton St
- 3019 Wheeler St
- 3035 Fulton St
Your Personal Tour Guide
Ask me questions while you tour the home.