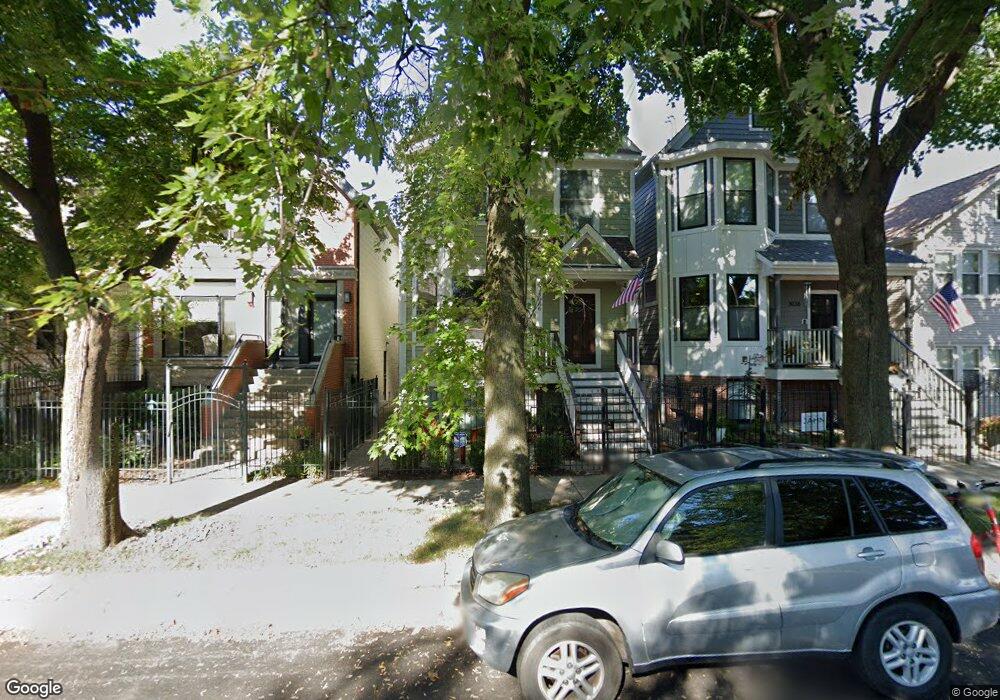
3036 N Hoyne Ave Unit 2 Chicago, IL 60618
Roscoe Village NeighborhoodEstimated Value: $1,555,983 - $1,971,000
5
Beds
4
Baths
2,933
Sq Ft
$593/Sq Ft
Est. Value
About This Home
This home is located at 3036 N Hoyne Ave Unit 2, Chicago, IL 60618 and is currently estimated at $1,737,996, approximately $592 per square foot. 3036 N Hoyne Ave Unit 2 is a home located in Cook County with nearby schools including Jahn School of Fine Arts, Lake View High School, and Alphonsus Academy & Center For The Arts.
Ownership History
Date
Name
Owned For
Owner Type
Purchase Details
Closed on
Dec 20, 2022
Sold by
Capdevielle Gina M
Bought by
Gina M Capdevielle Revocable Declaration Of T and Capdevielle
Current Estimated Value
Purchase Details
Closed on
Apr 27, 2020
Sold by
Chicago Title Land Trust Company
Bought by
Capdevielle Gina and Reyes Ruben
Home Financials for this Owner
Home Financials are based on the most recent Mortgage that was taken out on this home.
Original Mortgage
$944,000
Interest Rate
4.25%
Mortgage Type
New Conventional
Purchase Details
Closed on
May 24, 2013
Sold by
Murphy Martin and Murphy Wendy L
Bought by
Chicago Title Land Trust Co and Trust No 8002361731
Home Financials for this Owner
Home Financials are based on the most recent Mortgage that was taken out on this home.
Original Mortgage
$1,000,000
Interest Rate
3.6%
Mortgage Type
Commercial
Purchase Details
Closed on
Nov 3, 1999
Sold by
American National Bk & Tr Co Of Chicago
Bought by
Maloney John T and Wilson Catherine
Create a Home Valuation Report for This Property
The Home Valuation Report is an in-depth analysis detailing your home's value as well as a comparison with similar homes in the area
Home Values in the Area
Average Home Value in this Area
Purchase History
| Date | Buyer | Sale Price | Title Company |
|---|---|---|---|
| Gina M Capdevielle Revocable Declaration Of T | -- | None Listed On Document | |
| Capdevielle Gina | $1,180,000 | Chicago Title | |
| Chicago Title Land Trust Co | $1,250,000 | None Available | |
| Maloney John T | -- | -- |
Source: Public Records
Mortgage History
| Date | Status | Borrower | Loan Amount |
|---|---|---|---|
| Previous Owner | Capdevielle Gina | $944,000 | |
| Previous Owner | Chicago Title Land Trust Co | $1,000,000 |
Source: Public Records
Tax History Compared to Growth
Tax History
| Year | Tax Paid | Tax Assessment Tax Assessment Total Assessment is a certain percentage of the fair market value that is determined by local assessors to be the total taxable value of land and additions on the property. | Land | Improvement |
|---|---|---|---|---|
| 2024 | $21,455 | $129,000 | $38,440 | $90,560 |
| 2023 | $20,893 | $105,000 | $31,000 | $74,000 |
| 2022 | $20,893 | $105,000 | $31,000 | $74,000 |
| 2021 | $21,115 | $105,000 | $31,000 | $74,000 |
| 2020 | $17,029 | $79,545 | $14,880 | $64,665 |
| 2019 | $16,873 | $87,413 | $14,880 | $72,533 |
| 2018 | $17,643 | $92,751 | $14,880 | $77,871 |
| 2017 | $13,596 | $66,532 | $13,020 | $53,512 |
| 2016 | $12,825 | $66,532 | $13,020 | $53,512 |
| 2015 | $11,711 | $66,532 | $13,020 | $53,512 |
| 2014 | $9,170 | $49,426 | $9,920 | $39,506 |
| 2013 | $8,989 | $49,426 | $9,920 | $39,506 |
Source: Public Records
Map
Nearby Homes
- 3040 N Hoyne Ave
- 3015 N Hamilton Ave
- 3002 N Hoyne Ave
- 2020 W Barry Ave
- 3137 N Hoyne Ave
- 2933 N Clybourn Ave Unit 204
- 2043 W Belmont Ave Unit 3
- 2141 W Belmont Ave Unit 3
- 3009 N Damen Ave Unit 2
- 2027 W Belmont Ave Unit 1
- 2149 W Belmont Ave Unit 3W
- 3140 N Leavitt St
- 2130 W Belmont Ave Unit 3A
- 2140 W Belmont Ave Unit 1
- 2218 W Oakdale Ave
- 2209 W Belmont Ave Unit 3
- 2902 N Seeley Ave
- 1926 W Wellington Ave
- 3107 N Oakley Ave
- 2222 W Belmont Ave Unit 504
- 3036 N Hoyne Ave
- 3034 N Hoyne Ave
- 3038 N Hoyne Ave
- 3030 N Hoyne Ave
- 3040 N Hoyne Ave Unit 2
- 3042 N Hoyne Ave
- 3028 N Hoyne Ave
- 3046 N Hoyne Ave
- 3026 N Hoyne Ave
- 3026 N Hoyne Ave
- 3026 N Hoyne Ave Unit 1
- 3026 N Hoyne Ave Unit 1
- 3026 N Hoyne Ave Unit B
- 3048 N Hoyne Ave
- 3022 N Hoyne Ave Unit 2
- 3022 N Hoyne Ave
- 3022 N Hoyne Ave Unit 1
- 3035 N Hamilton Ave
- 3033 N Hamilton Ave
- 3039 N Hamilton Ave