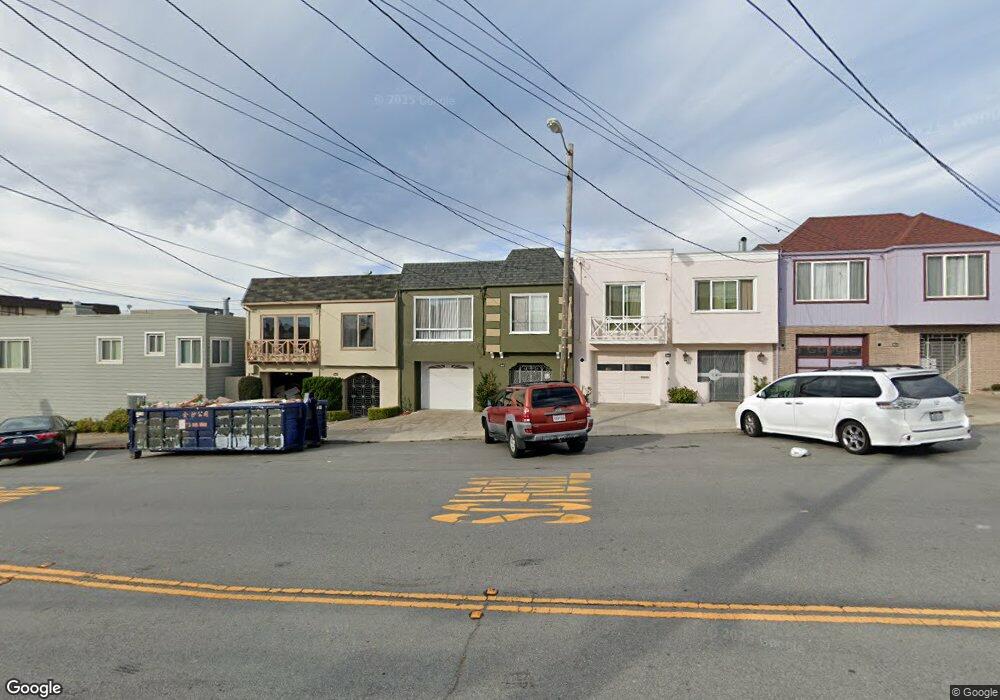
3036 Noriega St San Francisco, CA 94122
Outer Sunset NeighborhoodEstimated Value: $1,263,000 - $1,440,819
--
Bed
1
Bath
1,200
Sq Ft
$1,141/Sq Ft
Est. Value
About This Home
This home is located at 3036 Noriega St, San Francisco, CA 94122 and is currently estimated at $1,369,205, approximately $1,141 per square foot. 3036 Noriega St is a home located in San Francisco County with nearby schools including Key (Francis Scott) Elementary School, Giannini (A.P.) Middle School, and Holy Name Elementary School.
Ownership History
Date
Name
Owned For
Owner Type
Purchase Details
Closed on
Apr 13, 2016
Sold by
Lee May Y
Bought by
Lee May Y and Zhang Jack H
Current Estimated Value
Home Financials for this Owner
Home Financials are based on the most recent Mortgage that was taken out on this home.
Original Mortgage
$360,000
Outstanding Balance
$152,931
Interest Rate
2.96%
Mortgage Type
New Conventional
Estimated Equity
$1,216,274
Purchase Details
Closed on
Mar 25, 2013
Sold by
Zhang Jack H
Bought by
Lee May Y
Home Financials for this Owner
Home Financials are based on the most recent Mortgage that was taken out on this home.
Original Mortgage
$413,000
Interest Rate
3.54%
Mortgage Type
New Conventional
Purchase Details
Closed on
Aug 24, 2001
Sold by
Lee May Ying and Zhang Jack
Bought by
Lee May Y
Home Financials for this Owner
Home Financials are based on the most recent Mortgage that was taken out on this home.
Original Mortgage
$441,500
Interest Rate
7%
Purchase Details
Closed on
Sep 27, 2000
Sold by
Cesky Marie Ann
Bought by
Zhang Jack and Lee May Ying
Home Financials for this Owner
Home Financials are based on the most recent Mortgage that was taken out on this home.
Original Mortgage
$382,450
Interest Rate
8%
Create a Home Valuation Report for This Property
The Home Valuation Report is an in-depth analysis detailing your home's value as well as a comparison with similar homes in the area
Home Values in the Area
Average Home Value in this Area
Purchase History
| Date | Buyer | Sale Price | Title Company |
|---|---|---|---|
| Lee May Y | -- | Chicago Title Company | |
| Lee May Y | -- | First American Title Company | |
| Lee May Y | -- | Fidelity National Title Co | |
| Zhang Jack | $425,000 | Old Republic Title Company |
Source: Public Records
Mortgage History
| Date | Status | Borrower | Loan Amount |
|---|---|---|---|
| Open | Lee May Y | $360,000 | |
| Closed | Lee May Y | $413,000 | |
| Closed | Lee May Y | $441,500 | |
| Closed | Zhang Jack | $382,450 |
Source: Public Records
Tax History Compared to Growth
Tax History
| Year | Tax Paid | Tax Assessment Tax Assessment Total Assessment is a certain percentage of the fair market value that is determined by local assessors to be the total taxable value of land and additions on the property. | Land | Improvement |
|---|---|---|---|---|
| 2025 | $8,927 | $715,717 | $384,235 | $331,482 |
| 2024 | $8,927 | $701,684 | $376,701 | $324,983 |
| 2023 | $8,785 | $687,926 | $369,315 | $318,611 |
| 2022 | $8,607 | $674,439 | $362,074 | $312,365 |
| 2021 | $8,450 | $661,217 | $354,975 | $306,242 |
| 2020 | $8,499 | $654,439 | $351,336 | $303,103 |
| 2019 | $8,210 | $641,609 | $344,448 | $297,161 |
| 2018 | $7,933 | $629,030 | $337,695 | $291,335 |
| 2017 | $7,539 | $616,697 | $331,074 | $285,623 |
| 2016 | $7,399 | $604,607 | $324,583 | $280,024 |
| 2015 | $7,322 | $595,527 | $319,708 | $275,819 |
| 2014 | $7,195 | $583,863 | $313,446 | $270,417 |
Source: Public Records
Map
Nearby Homes