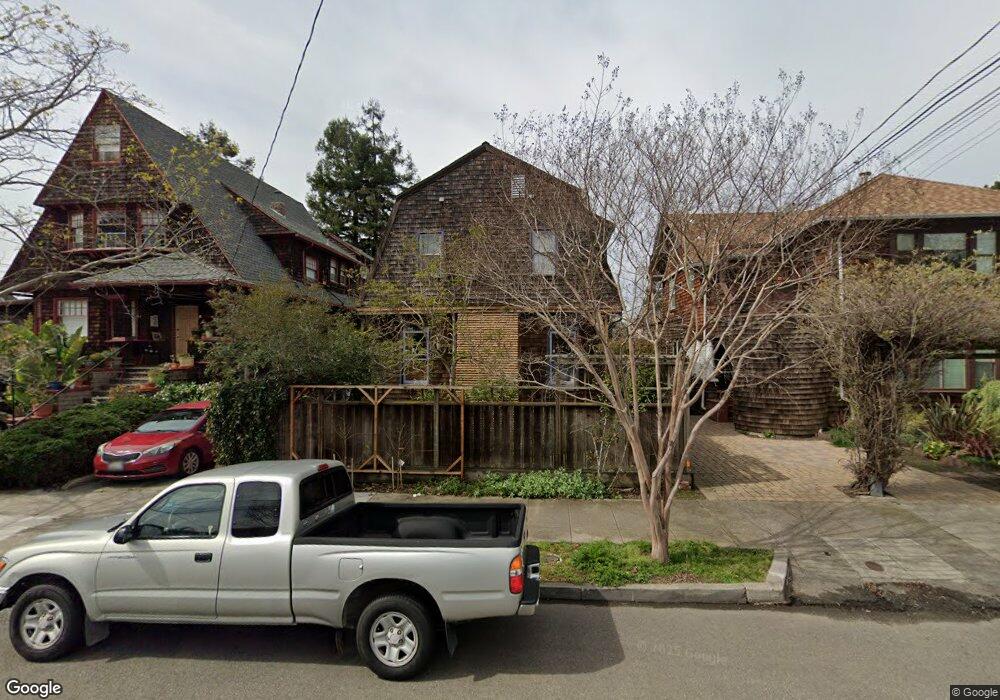
3038 Fulton St Berkeley, CA 94705
South Berkeley NeighborhoodEstimated Value: $1,865,000 - $2,086,000
5
Beds
3
Baths
2,942
Sq Ft
$671/Sq Ft
Est. Value
About This Home
This home is located at 3038 Fulton St, Berkeley, CA 94705 and is currently estimated at $1,975,500, approximately $671 per square foot. 3038 Fulton St is a home located in Alameda County with nearby schools including Malcolm X Elementary School, Emerson Elementary School, and John Muir Elementary School.
Ownership History
Date
Name
Owned For
Owner Type
Purchase Details
Closed on
Jan 10, 2023
Sold by
Popplewell Deirdre R
Bought by
Louise J Belle And Deirdre R Popplewell 2023
Current Estimated Value
Purchase Details
Closed on
Oct 25, 2021
Sold by
Grossman Heather B
Bought by
Grossman Heather B and Restated Grossman Revocable
Purchase Details
Closed on
Jan 23, 2020
Sold by
Popplewell Deirdre R and Grossman Heather B
Bought by
The Popplewell 1984 Trust Dated April 25
Purchase Details
Closed on
Oct 5, 2012
Sold by
Popplewell Derek W and Popplewell Helen G
Bought by
Popplewell Derek Wydham and Popplewell Helen Graham
Purchase Details
Closed on
Apr 5, 1994
Sold by
Popplewell Derek Wydham and Popplewell Helen Graham
Bought by
Popplewell Derek W and Popplewell Helen G
Create a Home Valuation Report for This Property
The Home Valuation Report is an in-depth analysis detailing your home's value as well as a comparison with similar homes in the area
Home Values in the Area
Average Home Value in this Area
Purchase History
| Date | Buyer | Sale Price | Title Company |
|---|---|---|---|
| Louise J Belle And Deirdre R Popplewell 2023 | -- | -- | |
| Grossman Heather B | -- | None Available | |
| The Popplewell 1984 Trust Dated April 25 | -- | None Available | |
| Popplewell Derek Wydham | -- | None Available | |
| Popplewell Derek W | -- | -- |
Source: Public Records
Tax History
| Year | Tax Paid | Tax Assessment Tax Assessment Total Assessment is a certain percentage of the fair market value that is determined by local assessors to be the total taxable value of land and additions on the property. | Land | Improvement |
|---|---|---|---|---|
| 2025 | $8,524 | $71,211 | $41,925 | $36,286 |
| 2024 | $8,524 | $69,678 | $41,103 | $35,575 |
| 2023 | $8,218 | $75,174 | $40,297 | $34,877 |
| 2022 | $7,843 | $66,700 | $39,507 | $34,193 |
| 2021 | $7,754 | $65,256 | $38,733 | $33,523 |
| 2020 | $6,925 | $71,514 | $38,335 | $33,179 |
| 2019 | $6,198 | $70,113 | $37,584 | $32,529 |
| 2018 | $5,983 | $68,738 | $36,847 | $31,891 |
| 2017 | $5,733 | $67,391 | $36,125 | $31,266 |
| 2016 | $5,236 | $66,069 | $35,416 | $30,653 |
| 2015 | $5,112 | $65,076 | $34,884 | $30,192 |
| 2014 | $5,123 | $63,802 | $34,201 | $29,601 |
Source: Public Records
Map
Nearby Homes
- 3046 Deakin St
- 2124 Prince St
- 2110 Ashby Ave
- 2923 Wheeler St
- 2243 Ashby Ave
- 629 66th St
- 2057 Emerson St
- 6445 Irwin Ct
- 6555 Shattuck Ave
- 556 Alcatraz Ave
- 2917 Telegraph Ave
- 667 & 667A Alcatraz Ave
- 667 Alcatraz Ave
- 2935 Florence St
- 6320 Shattuck Ave
- 6300 Shattuck Ave Unit 1
- 6446 Colby St
- 2477 Prince St
- 2319 Ward St
- 2702 Dana St
- 3036 Fulton St Unit C
- 3036 Fulton St Unit B
- 3036 Fulton St Unit A
- 3040 Fulton St
- 3033 Wheeler St
- 3031 Wheeler St
- 3034 Fulton St
- 3042 Fulton St
- 3037 Wheeler St
- 3025 Wheeler St
- 3047 Wheeler St
- 3026 Fulton St
- 3046 Fulton St
- 3049 Wheeler St
- 3024 Fulton St
- 3021 Wheeler St
- 3048 Fulton St
- 3051 Wheeler St
- 3022 Fulton St
- 3087 Wheeler St
Your Personal Tour Guide
Ask me questions while you tour the home.