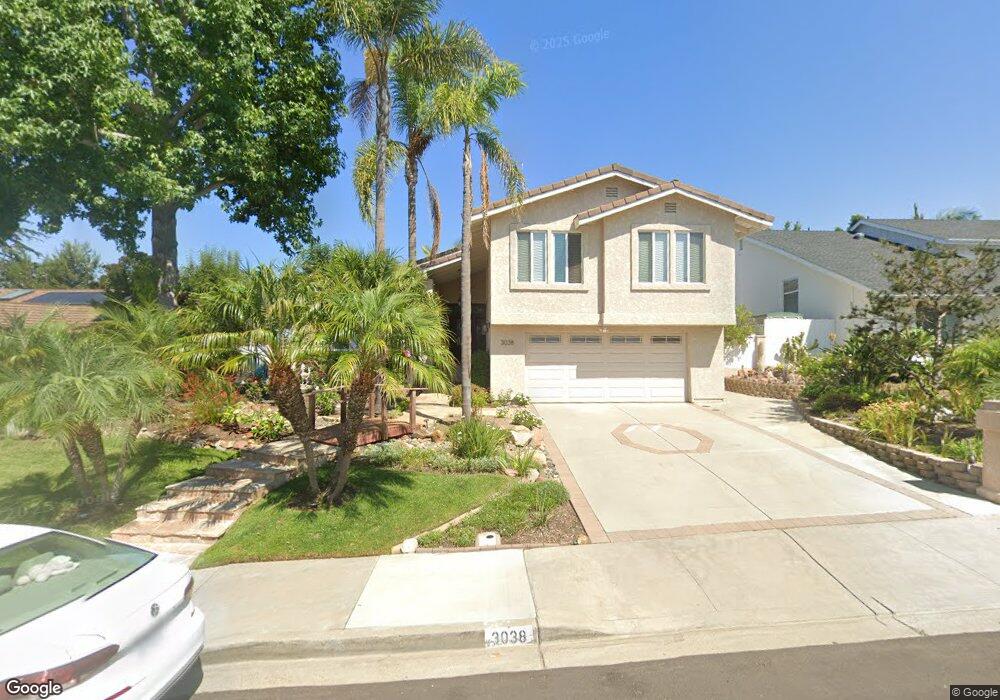
3038 Levante St Carlsbad, CA 92009
La Costa NeighborhoodEstimated Value: $1,894,000 - $1,986,554
5
Beds
4
Baths
2,926
Sq Ft
$660/Sq Ft
Est. Value
About This Home
This home is located at 3038 Levante St, Carlsbad, CA 92009 and is currently estimated at $1,931,889, approximately $660 per square foot. 3038 Levante St is a home located in San Diego County with nearby schools including La Costa Heights Elementary School, Oak Crest Middle School, and La Costa Canyon High School.
Ownership History
Date
Name
Owned For
Owner Type
Purchase Details
Closed on
Nov 2, 2006
Sold by
Cantrell Angela
Bought by
Cantrell Jerry L and Cantrell Angela D
Current Estimated Value
Purchase Details
Closed on
Sep 4, 2002
Sold by
Cantrell Angela and Luker Angela
Bought by
Cantrell Angela
Home Financials for this Owner
Home Financials are based on the most recent Mortgage that was taken out on this home.
Original Mortgage
$100,000
Interest Rate
5.65%
Mortgage Type
Purchase Money Mortgage
Purchase Details
Closed on
Oct 4, 1999
Sold by
Buechler Arvin R and Buechler Linda J
Bought by
Luker Angela
Home Financials for this Owner
Home Financials are based on the most recent Mortgage that was taken out on this home.
Original Mortgage
$65,000
Interest Rate
7.82%
Create a Home Valuation Report for This Property
The Home Valuation Report is an in-depth analysis detailing your home's value as well as a comparison with similar homes in the area
Home Values in the Area
Average Home Value in this Area
Purchase History
| Date | Buyer | Sale Price | Title Company |
|---|---|---|---|
| Cantrell Jerry L | -- | None Available | |
| Cantrell Angela | -- | Fidelity National Title Co | |
| Cantrell Angela | -- | Fidelity National Title Co | |
| Luker Angela | $315,000 | First American Title |
Source: Public Records
Mortgage History
| Date | Status | Borrower | Loan Amount |
|---|---|---|---|
| Closed | Cantrell Angela | $100,000 | |
| Closed | Luker Angela | $65,000 |
Source: Public Records
Tax History Compared to Growth
Tax History
| Year | Tax Paid | Tax Assessment Tax Assessment Total Assessment is a certain percentage of the fair market value that is determined by local assessors to be the total taxable value of land and additions on the property. | Land | Improvement |
|---|---|---|---|---|
| 2025 | $6,681 | $587,916 | $245,906 | $342,010 |
| 2024 | $6,681 | $576,389 | $241,085 | $335,304 |
| 2023 | $6,482 | $565,088 | $236,358 | $328,730 |
| 2022 | $6,322 | $554,009 | $231,724 | $322,285 |
| 2021 | $6,210 | $543,147 | $227,181 | $315,966 |
| 2020 | $6,104 | $537,579 | $224,852 | $312,727 |
| 2019 | $5,985 | $527,040 | $220,444 | $306,596 |
| 2018 | $5,887 | $516,707 | $216,122 | $300,585 |
| 2017 | $5,787 | $506,577 | $211,885 | $294,692 |
| 2016 | $5,613 | $496,645 | $207,731 | $288,914 |
| 2015 | $5,508 | $489,186 | $204,611 | $284,575 |
| 2014 | $5,377 | $479,604 | $200,603 | $279,001 |
Source: Public Records
Map
Nearby Homes
- 3101 Levante St
- 3008 Garboso St
- 7523 Quinta St
- 3109 Madera Ct
- 3112 Del Rey Ave
- 7508 Jerez Ct
- 0000 Cadencia St Between 7402-7412 Unit 474
- Kestrel - Plan 4 at The Nest at La Costa
- Robin - Plan 3 at The Nest at La Costa
- Lark - Plan 1 at The Nest at La Costa
- Wren - Plan 2 at The Nest at La Costa
- Starling - Plan 5 at The Nest at La Costa
- 2639 Pirineos Way Unit 231
- 8010 Calle Pinon
- 7702 Caminito Tingo Unit H203
- 2630 Pirineos Way Unit 5
- 2630 Pirineos Way Unit 4
- 2630 Pirineos Way Unit 14
- 2606 Galicia Way
- 7500 Viejo Castilla Way Unit 9
- 3040 Levante St
- 3036 Levante St
- 7715 Farol Ct
- 3042 Levante St
- 3034 Levante St
- 7719 Morada St
- 7713 Farol Ct
- 7717 Morada St
- 7714 Romeria St
- 3032 Levante St
- 3102 Levante St
- 7712 Romeria St
- 7711 Farol Ct
- 7726 Farol Place
- 3103 Levante St
- 7710 Romeria St
- 3104 Levante St
- 7707 Morada St
- 7709 Farol Ct
- 7724 Farol Place