

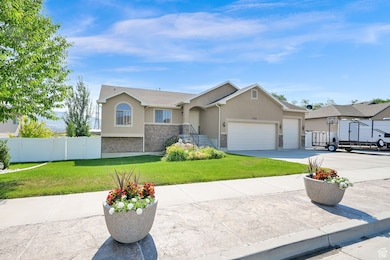
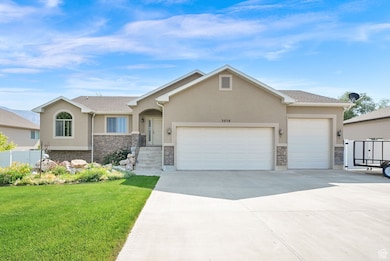
3038 N Whispering Meadow Ln Plain City, UT 84404
Estimated payment $3,584/month
Total Views
12,202
4
Beds
3
Baths
3,006
Sq Ft
$210
Price per Sq Ft
Highlights
- RV or Boat Parking
- Mountain View
- Rambler Architecture
- Solar Power System
- Secluded Lot
- Main Floor Primary Bedroom
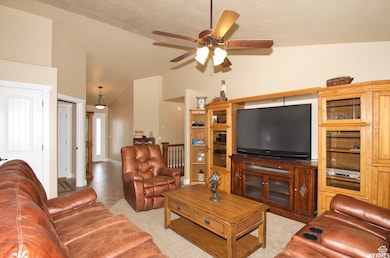
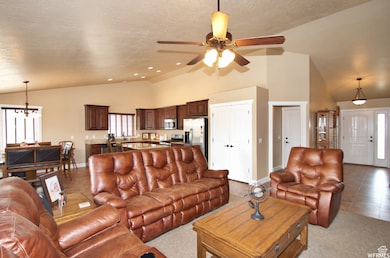
About This Home
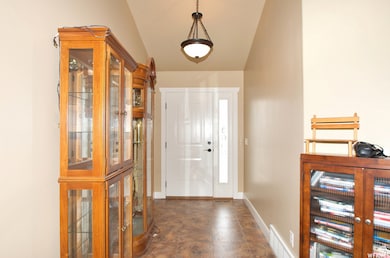
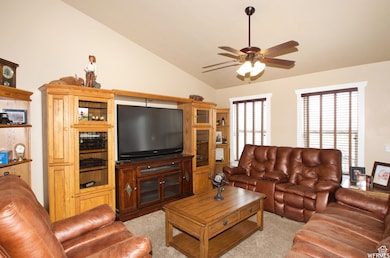
Quietly located in Plain City this home has it all! Featuring granite countertops throughout. knotty cherry cabinets, a huge 60x40 backyard patio, RV pad, solar panels and 220v in garage. The backyard in very private, includes a deck off the kitchen and no backyard neighbors. Basement is fully finished and features a guest suite with a huge bathroom attached.
Listing Agent
Coldwell Banker Realty (South Ogden) License #5791666 Listed on: 07/08/2025
Home Details
Home Type
- Single Family
Est. Annual Taxes
- $2,857
Year Built
- Built in 2012
Lot Details
- 10,019 Sq Ft Lot
- Dog Run
- Property is Fully Fenced
- Landscaped
- Secluded Lot
- Property is zoned Single-Family
HOA Fees
- $25 Monthly HOA Fees
Parking
- 3 Car Attached Garage
- 4 Open Parking Spaces
- RV or Boat Parking
Home Design
- Rambler Architecture
- Pitched Roof
- Stone Siding
- Stucco
Interior Spaces
- 3,006 Sq Ft Home
- 2-Story Property
- Ceiling Fan
- Double Pane Windows
- Blinds
- Sliding Doors
- Mountain Views
- Natural lighting in basement
- Gas Dryer Hookup
Kitchen
- Built-In Range
- Free-Standing Range
- Microwave
- Granite Countertops
- Disposal
Flooring
- Carpet
- Tile
Bedrooms and Bathrooms
- 4 Bedrooms | 3 Main Level Bedrooms
- Primary Bedroom on Main
- Walk-In Closet
- 3 Full Bathrooms
- Bathtub With Separate Shower Stall
Eco-Friendly Details
- Solar Power System
- Solar owned by a third party
- Reclaimed Water Irrigation System
Outdoor Features
- Storage Shed
Schools
- Plain City Elementary School
- Wahlquist Middle School
- Fremont High School
Utilities
- Forced Air Heating and Cooling System
- Natural Gas Connected
Listing and Financial Details
- Assessor Parcel Number 19-249-0002
Community Details
Overview
- Utah Management Association, Phone Number (801) 605-3000
- Still Creek Subdivision
Amenities
- Community Barbecue Grill
- Picnic Area
Recreation
- Community Playground
Map
Create a Home Valuation Report for This Property
The Home Valuation Report is an in-depth analysis detailing your home's value as well as a comparison with similar homes in the area
Home Values in the Area
Average Home Value in this Area
Tax History
| Year | Tax Paid | Tax Assessment Tax Assessment Total Assessment is a certain percentage of the fair market value that is determined by local assessors to be the total taxable value of land and additions on the property. | Land | Improvement |
|---|---|---|---|---|
| 2025 | $2,776 | $505,234 | $126,637 | $378,597 |
| 2024 | $2,807 | $496,000 | $126,637 | $369,363 |
| 2023 | $2,858 | $511,000 | $127,089 | $383,911 |
| 2022 | $2,898 | $535,000 | $127,089 | $407,911 |
| 2021 | $2,491 | $420,000 | $82,394 | $337,606 |
| 2020 | $2,323 | $358,000 | $67,387 | $290,613 |
| 2019 | $2,272 | $330,000 | $65,352 | $264,648 |
| 2018 | $2,269 | $316,000 | $65,352 | $250,648 |
| 2017 | $2,143 | $282,000 | $57,808 | $224,192 |
| 2016 | $2,117 | $153,037 | $29,990 | $123,047 |
| 2015 | $2,152 | $153,038 | $24,529 | $128,509 |
| 2014 | $1,979 | $136,276 | $24,529 | $111,747 |
Source: Public Records
Property History
| Date | Event | Price | List to Sale | Price per Sq Ft |
|---|---|---|---|---|
| 09/12/2025 09/12/25 | Price Changed | $630,000 | -2.9% | $210 / Sq Ft |
| 07/08/2025 07/08/25 | For Sale | $649,000 | -- | $216 / Sq Ft |
Source: UtahRealEstate.com
Purchase History
| Date | Type | Sale Price | Title Company |
|---|---|---|---|
| Warranty Deed | -- | Old Republic Title | |
| Warranty Deed | -- | Heritage West Title | |
| Warranty Deed | -- | North American Title Bountif | |
| Quit Claim Deed | -- | Accommodation | |
| Special Warranty Deed | -- | Bonneville Superior Title Co |
Source: Public Records
Mortgage History
| Date | Status | Loan Amount | Loan Type |
|---|---|---|---|
| Previous Owner | $204,000 | New Conventional |
Source: Public Records
About the Listing Agent
CoDee's Other Listings
Source: UtahRealEstate.com
MLS Number: 2097178
APN: 19-249-0002
Disclaimer: Certain information contained herein is derived from information provided by parties other than Homes.com. All information provided is deemed reliable, but is not guaranteed to be accurate and should be independently verified.
![]() IDX information is provided exclusively for consumers’ personal, non-commercial use, that it may not be used for any purpose other than to identify prospective properties consumers may be interested in purchasing, and that the data is deemed reliable but is not guaranteed accurate by the MLS. Licensor is only providing the MLS Content and not other sources of data provided in the Product.
IDX information is provided exclusively for consumers’ personal, non-commercial use, that it may not be used for any purpose other than to identify prospective properties consumers may be interested in purchasing, and that the data is deemed reliable but is not guaranteed accurate by the MLS. Licensor is only providing the MLS Content and not other sources of data provided in the Product.
Based on information from the Wasatch Front Regional Multiple Listing Service, Inc.. All data, including all measurements and calculations of area, is obtained from various sources and has not been, and will not be, verified by broker or the MLS. All information should be independently reviewed and verified for accuracy. Properties may or may not be listed by the office/agent presenting the information.
Nearby Homes
- 3080 N 3325 W
- 3468 Larkspur Ln
- 2864 N 3475 W
- 3187 Still Creek Pkwy
- 3158 W North Plain City Rd
- 3263 N 3450 W
- 3215 Saddlebrook Ln Unit 319
- 3198 N 3475 W
- 2861 N 3475 W
- Siena Plan at The Grove at JDC Ranch
- Carmel Plan at The Grove at JDC Ranch
- Dover Plan at The Grove at JDC Ranch
- Newport Plan at The Grove at JDC Ranch
- 3209 N 2875 W Unit 34
- 2788 N 3225 W Unit 206
- 2768 N 3225 W Unit 208
- 3229 N 2875 W Unit 32
- 3241 N 2875 W Unit 31
- 2771 N 3225 W Unit 204
- 2761 N 3225 W Unit 203
- 1148 W Spring Valley Ln
- 1189 W Fallow Way
- 2100 N Highway 89
- 811 W 1340 N
- 255 W 2700 N
- 163 Savannah Ln
- 115 E 2300 N
- 200 E 2300 N
- 275 W Pennsylvania Dr Unit Side Apartment
- 2421 N 400 E Unit D7
- 1750 N 400 E
- 196 N Sam Gates Rd
- 1169 N Orchard Ave
- 551 E 900 St N
- 434 W 7th St
- 405 E 475 N
- 381 N Washington Blvd
- 248 W Downs Cir
- 1454 N Fowler Ave
- 930 E 1150 N