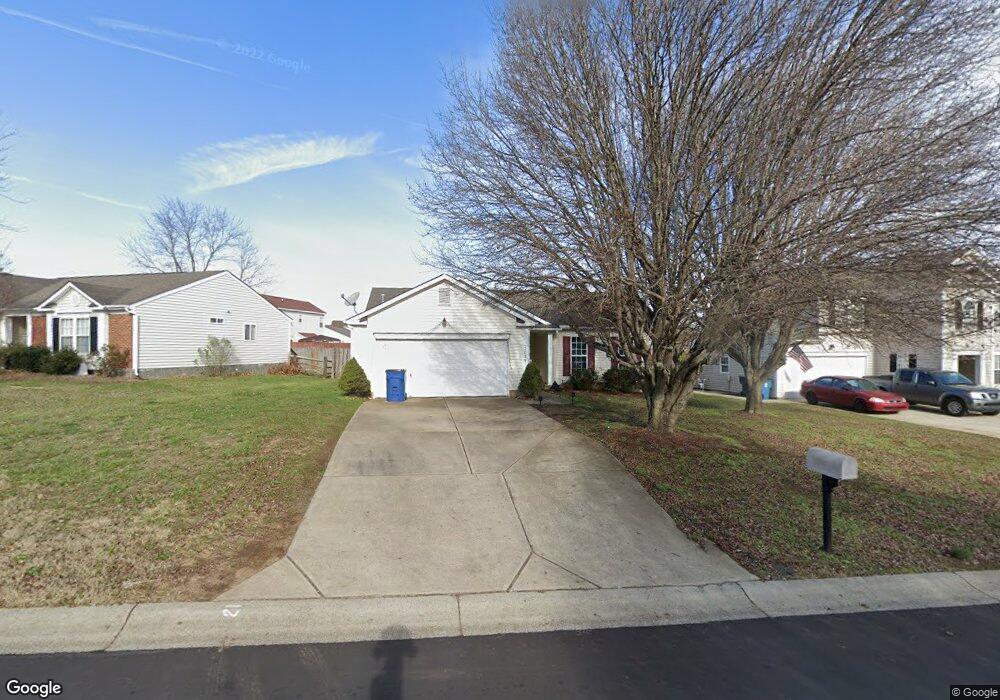
3039 Hawick Commons Dr Concord, NC 28027
Estimated Value: $291,776 - $312,000
3
Beds
2
Baths
1,200
Sq Ft
$251/Sq Ft
Est. Value
About This Home
This home is located at 3039 Hawick Commons Dr, Concord, NC 28027 and is currently estimated at $301,694, approximately $251 per square foot. 3039 Hawick Commons Dr is a home located in Cabarrus County with nearby schools including Pitts School Road Elementary School, Roberta Road Middle School, and Jay M. Robinson High School.
Ownership History
Date
Name
Owned For
Owner Type
Purchase Details
Closed on
Oct 4, 2023
Sold by
True North Borrower North Carolina Llc
Bought by
True North Property Owner C Llc
Current Estimated Value
Home Financials for this Owner
Home Financials are based on the most recent Mortgage that was taken out on this home.
Original Mortgage
$315,130,000
Outstanding Balance
$207,532,713
Interest Rate
7.23%
Mortgage Type
New Conventional
Estimated Equity
-$207,231,019
Purchase Details
Closed on
Aug 24, 2022
Sold by
Lipe Shawn W and Lipe Charmayne Angela
Bought by
True North Borrower North Carolina Llc and Investment Property Exchange Services Inc
Purchase Details
Closed on
Aug 31, 1999
Sold by
The Mulvaney Group Ltd
Bought by
Lipe Shawn W
Home Financials for this Owner
Home Financials are based on the most recent Mortgage that was taken out on this home.
Original Mortgage
$110,300
Interest Rate
7.5%
Mortgage Type
FHA
Create a Home Valuation Report for This Property
The Home Valuation Report is an in-depth analysis detailing your home's value as well as a comparison with similar homes in the area
Home Values in the Area
Average Home Value in this Area
Purchase History
| Date | Buyer | Sale Price | Title Company |
|---|---|---|---|
| True North Property Owner C Llc | -- | None Listed On Document | |
| True North Borrower North Carolina Llc | $290,000 | Investors Title | |
| Lipe Shawn W | $111,500 | -- |
Source: Public Records
Mortgage History
| Date | Status | Borrower | Loan Amount |
|---|---|---|---|
| Open | True North Property Owner C Llc | $315,130,000 | |
| Previous Owner | Lipe Shawn W | $110,300 |
Source: Public Records
Tax History
| Year | Tax Paid | Tax Assessment Tax Assessment Total Assessment is a certain percentage of the fair market value that is determined by local assessors to be the total taxable value of land and additions on the property. | Land | Improvement |
|---|---|---|---|---|
| 2025 | $2,232 | $307,450 | $60,000 | $247,450 |
| 2024 | $2,232 | $307,450 | $60,000 | $247,450 |
| 2023 | $1,394 | $156,620 | $45,000 | $111,620 |
| 2022 | $1,394 | $156,620 | $45,000 | $111,620 |
| 2021 | $1,394 | $156,620 | $45,000 | $111,620 |
| 2020 | $1,394 | $156,620 | $45,000 | $111,620 |
| 2019 | $1,088 | $122,290 | $25,000 | $97,290 |
| 2018 | $1,064 | $122,290 | $25,000 | $97,290 |
| 2017 | $1,017 | $122,290 | $25,000 | $97,290 |
| 2016 | $1,017 | $115,210 | $25,000 | $90,210 |
| 2015 | $935 | $115,210 | $25,000 | $90,210 |
| 2014 | $935 | $115,210 | $25,000 | $90,210 |
Source: Public Records
Map
Nearby Homes
- 5307 Bendix Ct
- 4444 Bravery Place SW Unit 116
- 4349 Roberta Rd
- 3693 Stonefield St SW
- 5421 Roberta Meadows Ct
- 4271 Maybrook Ct SW
- 855 Juanita Dr SW
- 842 Treva Anne Dr SW
- 4463 Legend St SW
- 3913 Stough Rd
- 5361 Brickyard Terrace Ct
- 248 Corrie Ann Dr
- 4266 Barley St SW
- 3455 Roberta Rd
- 3369 Roberta Rd
- 3907 Melissa Dr
- 4570 Lanstone Ct SW
- 3333 Roberta Rd
- 3618 Waterloo Dr
- 4122 Amarillo Dr SW
- 3033 Hawick Commons Dr
- 3045 Hawick Commons Dr
- 5898 Culloden Ct
- 3027 Hawick Commons Dr
- 4995 Astonshire Ln
- 3051 Hawick Commons Dr
- 3026 Hawick Commons Dr
- 3032 Hawick Commons Dr
- 3020 Hawick Commons Dr
- 4991 Astonshire Ln
- 4991 Astonshire Ln
- 4991 Astonshire Ln Unit 122
- 5900 Culloden Ct
- 3038 Hawick Commons Dr
- 3021 Hawick Commons Dr
- 5894 Culloden Ct
- 3044 Hawick Commons Dr
- 4987 Astonshire Ln
- 3014 Hawick Commons Dr
- 3050 Hawick Commons Dr
Your Personal Tour Guide
Ask me questions while you tour the home.