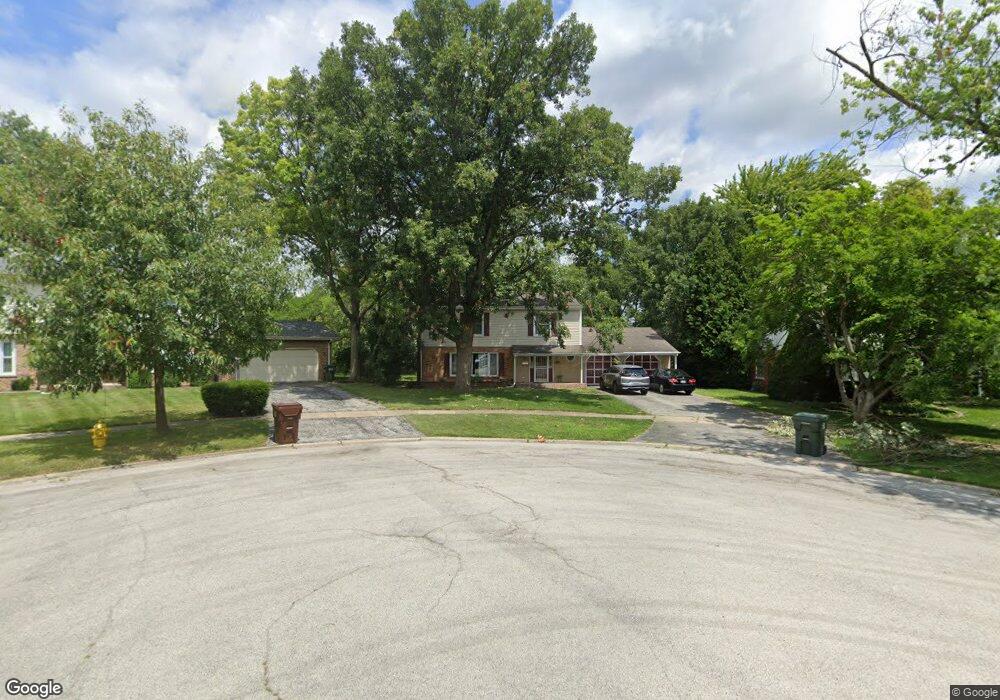
3039 Scott Crescent Flossmoor, IL 60422
Estimated Value: $357,032 - $380,000
4
Beds
3
Baths
1,988
Sq Ft
$187/Sq Ft
Est. Value
About This Home
This home is located at 3039 Scott Crescent, Flossmoor, IL 60422 and is currently estimated at $371,758, approximately $187 per square foot. 3039 Scott Crescent is a home located in Cook County with nearby schools including Heather Hill Elementary School, Parker Junior High School, and Homewood-Flossmoor High School.
Ownership History
Date
Name
Owned For
Owner Type
Purchase Details
Closed on
Feb 25, 2004
Sold by
Oconnor Michael J
Bought by
Adkins Raymond V
Current Estimated Value
Home Financials for this Owner
Home Financials are based on the most recent Mortgage that was taken out on this home.
Original Mortgage
$219,200
Outstanding Balance
$106,231
Interest Rate
6.2%
Mortgage Type
Unknown
Estimated Equity
$265,527
Purchase Details
Closed on
Apr 8, 2003
Sold by
Fannie Mae
Bought by
Oconnor Michael
Purchase Details
Closed on
Jan 22, 2003
Sold by
Johnson
Bought by
Federal National Mortgage Association
Purchase Details
Closed on
Jul 3, 1997
Sold by
Johnson Craig B and Johnson Tina M
Bought by
Johnson Tina M
Create a Home Valuation Report for This Property
The Home Valuation Report is an in-depth analysis detailing your home's value as well as a comparison with similar homes in the area
Home Values in the Area
Average Home Value in this Area
Purchase History
| Date | Buyer | Sale Price | Title Company |
|---|---|---|---|
| Adkins Raymond V | $274,000 | Chicago Title Insurance Comp | |
| Oconnor Michael | -- | First American Title | |
| Oconnor Michael | -- | First American Title | |
| Federal National Mortgage Association | -- | -- | |
| Johnson Tina M | -- | -- |
Source: Public Records
Mortgage History
| Date | Status | Borrower | Loan Amount |
|---|---|---|---|
| Open | Adkins Raymond V | $219,200 | |
| Closed | Adkins Raymond V | $54,800 |
Source: Public Records
Tax History Compared to Growth
Tax History
| Year | Tax Paid | Tax Assessment Tax Assessment Total Assessment is a certain percentage of the fair market value that is determined by local assessors to be the total taxable value of land and additions on the property. | Land | Improvement |
|---|---|---|---|---|
| 2024 | $10,507 | $28,000 | $6,813 | $21,187 |
| 2023 | $9,295 | $28,000 | $6,813 | $21,187 |
| 2022 | $9,295 | $20,702 | $5,884 | $14,818 |
| 2021 | $9,360 | $20,701 | $5,884 | $14,817 |
| 2020 | $9,084 | $20,701 | $5,884 | $14,817 |
| 2019 | $9,057 | $20,235 | $5,264 | $14,971 |
| 2018 | $8,713 | $20,235 | $5,264 | $14,971 |
| 2017 | $8,585 | $20,235 | $5,264 | $14,971 |
| 2016 | $8,184 | $17,951 | $4,645 | $13,306 |
| 2015 | $8,157 | $17,951 | $4,645 | $13,306 |
| 2014 | $8,031 | $17,951 | $4,645 | $13,306 |
| 2013 | $7,554 | $18,439 | $4,645 | $13,794 |
Source: Public Records
Map
Nearby Homes
- 3045 Scott Crescent
- 3013 Mac Heath Crescent
- 1450 Tanglewood St Unit 1B
- 3232 Chestnut Dr
- 1402 Berry Ln
- 3118 Elaine Ct Unit 232
- 1248 Berry Ln
- 1437 Woodhollow Dr
- 3037 Candlewood Ct
- 2937 Kathleen Ln
- 1248 Oakmont Ave
- 2931 Sunset Ave
- 2929 Flossmoor Rd
- 19020 Kedzie Ave
- 2817 Flossmoor Rd
- 1141 Leavitt Ave Unit 115
- 1139 Leavitt Ave Unit 212
- 1139 Leavitt Ave Unit 313
- 1833 Pheasant Ct
- 1117 Leavitt Ave Unit 110
- 3033 Scott Crescent
- 3043 Scott Crescent
- 3027 Scott Crescent
- 3040 Bob o Link Rd
- 3034 Bob o Link Rd
- 3026 Bob o Link Rd
- 1349 Heather Hill Crescent
- 1403 Heather Hill Crescent
- 1341 Heather Hill Crescent
- 3021 Scott Crescent
- 1341 Heather Hillcrescen
- 3049 Scott Crescent
- 1407 Heather Hill Crescent
- 3020 Bob o Link Rd
- 3050 Bob o Link Rd
- 3034 Scott Crescent
- 3028 Scott Crescent
- 1413 Heather Hill Crescent
- 3051 Scott Crescent
- 3040 Scott Crescent