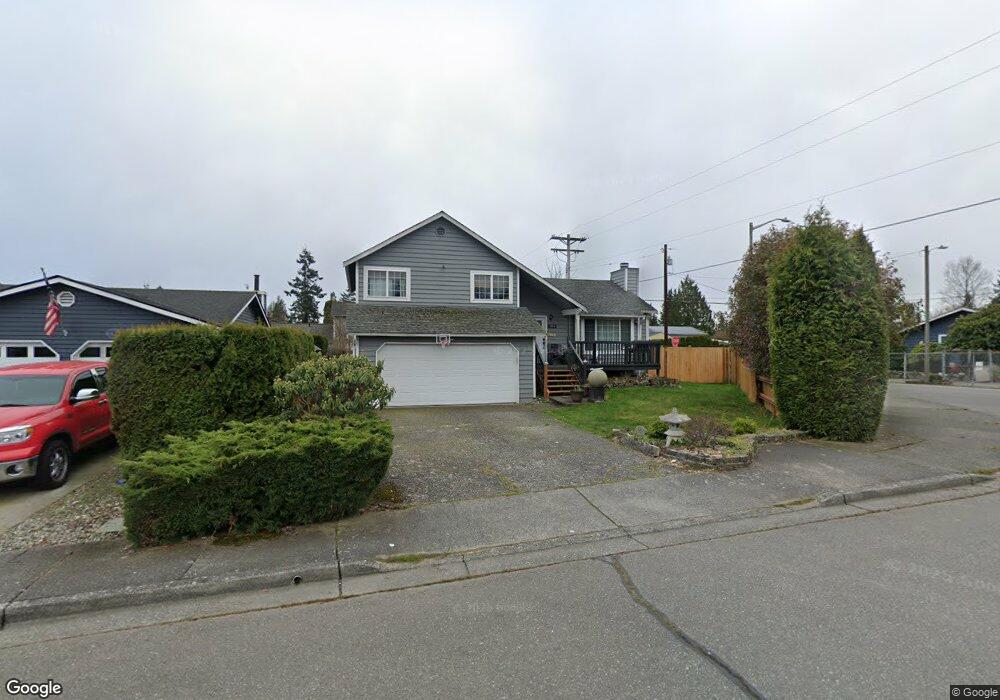
304 106th Place SE Everett, WA 98208
Everett Mall South NeighborhoodEstimated Value: $602,000 - $662,000
3
Beds
3
Baths
1,314
Sq Ft
$480/Sq Ft
Est. Value
About This Home
This home is located at 304 106th Place SE, Everett, WA 98208 and is currently estimated at $630,438, approximately $479 per square foot. 304 106th Place SE is a home located in Snohomish County with nearby schools including Olivia Park Elementary School, Explorer Middle School, and Mariner High School.
Ownership History
Date
Name
Owned For
Owner Type
Purchase Details
Closed on
Oct 26, 2006
Sold by
Saradpon Ramon and Saradpon Jorge
Bought by
Saradpon Joebert S
Current Estimated Value
Home Financials for this Owner
Home Financials are based on the most recent Mortgage that was taken out on this home.
Original Mortgage
$239,000
Outstanding Balance
$141,926
Interest Rate
6.28%
Mortgage Type
Stand Alone First
Estimated Equity
$488,512
Purchase Details
Closed on
Apr 26, 2001
Sold by
Saradpon Lolita
Bought by
Saradpon Ramon
Home Financials for this Owner
Home Financials are based on the most recent Mortgage that was taken out on this home.
Original Mortgage
$178,552
Interest Rate
6.98%
Purchase Details
Closed on
Mar 21, 1995
Sold by
Inkster Terry J and Inkster Karen R
Bought by
Nguon Chanthy and Nguon Vy Keo
Home Financials for this Owner
Home Financials are based on the most recent Mortgage that was taken out on this home.
Original Mortgage
$130,150
Interest Rate
8.86%
Create a Home Valuation Report for This Property
The Home Valuation Report is an in-depth analysis detailing your home's value as well as a comparison with similar homes in the area
Home Values in the Area
Average Home Value in this Area
Purchase History
| Date | Buyer | Sale Price | Title Company |
|---|---|---|---|
| Saradpon Joebert S | $137,200 | Old Republic Title Ltd | |
| Saradpon Ramon | -- | First American Title Ins Co | |
| Saradpon Ramon | $187,950 | First American Title Ins Co | |
| Nguon Chanthy | $137,000 | -- |
Source: Public Records
Mortgage History
| Date | Status | Borrower | Loan Amount |
|---|---|---|---|
| Open | Saradpon Joebert S | $239,000 | |
| Previous Owner | Saradpon Ramon | $178,552 | |
| Previous Owner | Nguon Chanthy | $130,150 |
Source: Public Records
Tax History Compared to Growth
Tax History
| Year | Tax Paid | Tax Assessment Tax Assessment Total Assessment is a certain percentage of the fair market value that is determined by local assessors to be the total taxable value of land and additions on the property. | Land | Improvement |
|---|---|---|---|---|
| 2025 | $4,151 | $574,300 | $367,500 | $206,800 |
| 2024 | $4,151 | $535,500 | $338,500 | $197,000 |
| 2023 | $4,372 | $578,500 | $353,100 | $225,400 |
| 2022 | $3,698 | $423,900 | $233,700 | $190,200 |
| 2020 | $3,119 | $359,200 | $191,900 | $167,300 |
| 2019 | $2,790 | $325,400 | $162,500 | $162,900 |
| 2018 | $2,800 | $281,200 | $145,400 | $135,800 |
| 2017 | $2,472 | $254,000 | $126,400 | $127,600 |
| 2016 | $2,314 | $235,500 | $115,900 | $119,600 |
| 2015 | $2,338 | $215,000 | $102,600 | $112,400 |
| 2013 | $2,113 | $180,900 | $88,400 | $92,500 |
Source: Public Records
Map
Nearby Homes
- 10805 5th Ave SE
- 2 xx 106th St SE
- 726 109th St SE
- 11201 3rd Ave SE Unit 39G
- 625 101st Place SE Unit C
- 217 112th St SW Unit D103
- 620 112th St SE Unit 154
- 620 112th St SE Unit 193
- 620 112th St SE Unit 227
- 620 112th St SE Unit 323
- 620 112th St SE Unit 205
- 620 112th St SE Unit 23
- 620 112th St SE Unit 174
- 10825 4th Ave W
- 10919 10th Dr SE
- 1009 112th St SE Unit B305
- 11100 4th Ave W Unit 3
- 11100 4th Ave W Unit 28
- 10925 6th Ave W Unit B
- 11031 6th Ave W
- 308 106th Place SE
- 303 107th Place SE
- 412 106th Place SE
- 314 106th Place SE
- 223 107th St SE
- 307 107th Place SE
- 303 106th Place SE
- 309 106th Place SE
- 318 106th Place SE
- 221 107th St SE
- 10606 3rd Ave SE
- 306 106th St SE
- 315 106th Place SE
- 320 106th Place SE
- 302 107th Place SE
- 312 106th St SE
- 306 107th Place SE
- 10702 4th Ave SE