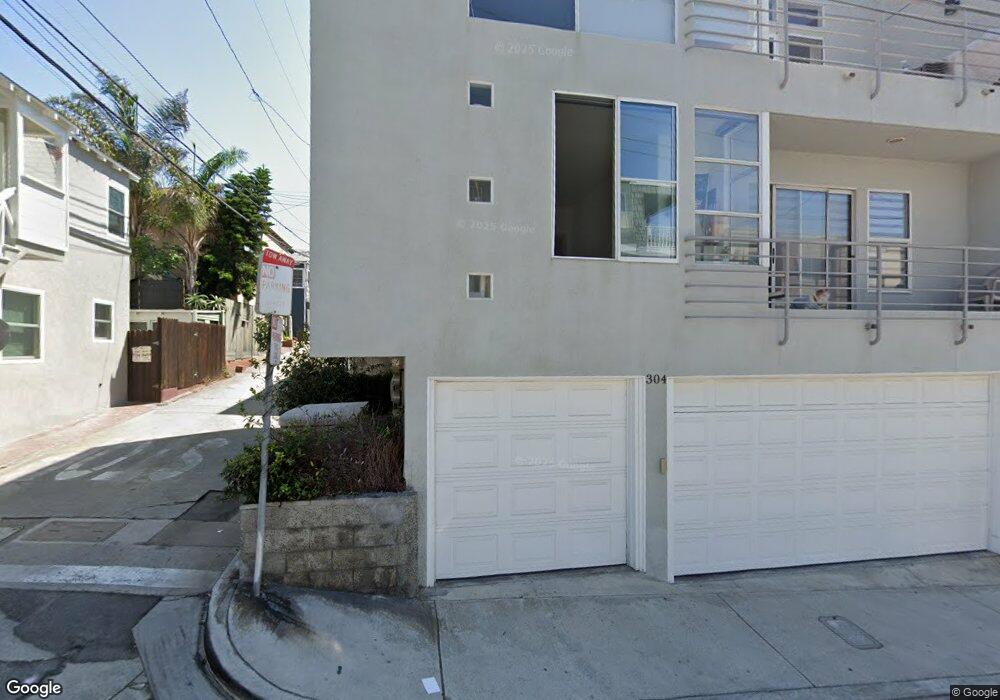
304 35th St Manhattan Beach, CA 90266
Estimated Value: $2,197,638 - $3,251,000
3
Beds
3
Baths
1,656
Sq Ft
$1,666/Sq Ft
Est. Value
About This Home
This home is located at 304 35th St, Manhattan Beach, CA 90266 and is currently estimated at $2,759,160, approximately $1,666 per square foot. 304 35th St is a home located in Los Angeles County with nearby schools including Grand View Elementary School, Manhattan Beach Middle School, and Mira Costa High School.
Ownership History
Date
Name
Owned For
Owner Type
Purchase Details
Closed on
Jan 13, 2009
Sold by
Morse Peter J
Bought by
Morse Peter John and Peter John Morse Revocable Tru
Current Estimated Value
Purchase Details
Closed on
Nov 29, 2005
Sold by
Morse Peter J
Bought by
Morse Peter John and Peter John Morse Revocable Tru
Purchase Details
Closed on
Aug 15, 2001
Sold by
Miller Marisa Lynn
Bought by
Morse Peter J
Home Financials for this Owner
Home Financials are based on the most recent Mortgage that was taken out on this home.
Original Mortgage
$166,000
Outstanding Balance
$59,358
Interest Rate
6%
Estimated Equity
$2,699,802
Purchase Details
Closed on
Oct 21, 1997
Sold by
Beacon Group Inc
Bought by
Miller Marisa Lynn
Home Financials for this Owner
Home Financials are based on the most recent Mortgage that was taken out on this home.
Original Mortgage
$300,000
Interest Rate
7.33%
Create a Home Valuation Report for This Property
The Home Valuation Report is an in-depth analysis detailing your home's value as well as a comparison with similar homes in the area
Home Values in the Area
Average Home Value in this Area
Purchase History
| Date | Buyer | Sale Price | Title Company |
|---|---|---|---|
| Morse Peter John | -- | None Available | |
| Morse Peter John | -- | -- | |
| Morse Peter J | $655,000 | Gateway Title Company | |
| Miller Marisa Lynn | $375,000 | North American Title Co |
Source: Public Records
Mortgage History
| Date | Status | Borrower | Loan Amount |
|---|---|---|---|
| Open | Morse Peter J | $166,000 | |
| Previous Owner | Miller Marisa Lynn | $300,000 |
Source: Public Records
Tax History
| Year | Tax Paid | Tax Assessment Tax Assessment Total Assessment is a certain percentage of the fair market value that is determined by local assessors to be the total taxable value of land and additions on the property. | Land | Improvement |
|---|---|---|---|---|
| 2025 | $11,118 | $967,612 | $236,355 | $731,257 |
| 2024 | $11,118 | $948,640 | $231,721 | $716,919 |
| 2023 | $10,824 | $930,040 | $227,178 | $702,862 |
| 2022 | $10,641 | $911,805 | $222,724 | $689,081 |
| 2021 | $10,475 | $893,927 | $218,357 | $675,570 |
| 2019 | $10,199 | $867,415 | $211,882 | $655,533 |
| 2018 | $9,996 | $850,408 | $207,728 | $642,680 |
| 2016 | $9,174 | $817,387 | $199,662 | $617,725 |
| 2015 | $8,985 | $805,110 | $196,663 | $608,447 |
| 2014 | $8,864 | $789,340 | $192,811 | $596,529 |
Source: Public Records
Map
Nearby Homes
Your Personal Tour Guide
Ask me questions while you tour the home.