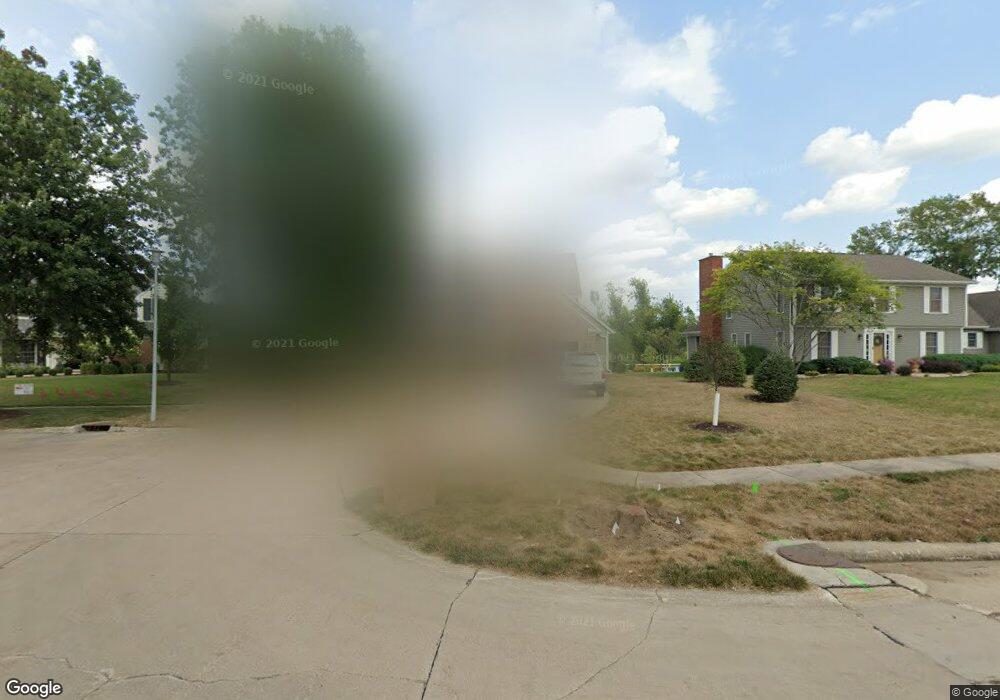
304 Ashland Ct SE Cedar Rapids, IA 52403
Estimated Value: $444,000 - $531,000
4
Beds
5
Baths
3,418
Sq Ft
$138/Sq Ft
Est. Value
About This Home
This home is located at 304 Ashland Ct SE, Cedar Rapids, IA 52403 and is currently estimated at $470,254, approximately $137 per square foot. 304 Ashland Ct SE is a home located in Linn County with nearby schools including Erskine Elementary School, McKinley STEAM Academy, and George Washington High School.
Ownership History
Date
Name
Owned For
Owner Type
Purchase Details
Closed on
Feb 15, 2013
Sold by
Visser Cynthia A and Eastburn Geoffrey L
Bought by
Eastburn Cynthia A and Eastburn Geoffrey L
Current Estimated Value
Home Financials for this Owner
Home Financials are based on the most recent Mortgage that was taken out on this home.
Original Mortgage
$181,700
Outstanding Balance
$123,344
Interest Rate
2.87%
Mortgage Type
Adjustable Rate Mortgage/ARM
Estimated Equity
$346,910
Purchase Details
Closed on
Feb 28, 2005
Sold by
Visser Kevin
Bought by
Visser Cynthia
Purchase Details
Closed on
Feb 22, 1999
Sold by
Pavik Ann Marie and Pavik Alvin L
Bought by
Pavik Alvin Louise and Pavik Ann Marie
Create a Home Valuation Report for This Property
The Home Valuation Report is an in-depth analysis detailing your home's value as well as a comparison with similar homes in the area
Home Values in the Area
Average Home Value in this Area
Purchase History
| Date | Buyer | Sale Price | Title Company |
|---|---|---|---|
| Eastburn Cynthia A | -- | None Available | |
| Visser Cynthia | -- | -- | |
| Pavik Alvin Louise | -- | -- |
Source: Public Records
Mortgage History
| Date | Status | Borrower | Loan Amount |
|---|---|---|---|
| Open | Eastburn Cynthia A | $181,700 |
Source: Public Records
Tax History Compared to Growth
Tax History
| Year | Tax Paid | Tax Assessment Tax Assessment Total Assessment is a certain percentage of the fair market value that is determined by local assessors to be the total taxable value of land and additions on the property. | Land | Improvement |
|---|---|---|---|---|
| 2025 | $7,510 | $469,400 | $61,900 | $407,500 |
| 2024 | $8,630 | $450,500 | $61,900 | $388,600 |
| 2023 | $8,630 | $450,500 | $61,900 | $388,600 |
| 2022 | $8,474 | $421,400 | $61,900 | $359,500 |
| 2021 | $9,004 | $421,400 | $61,900 | $359,500 |
| 2020 | $9,004 | $420,000 | $61,900 | $358,100 |
| 2019 | $8,272 | $395,500 | $61,900 | $333,600 |
| 2018 | $8,036 | $395,500 | $61,900 | $333,600 |
| 2017 | $8,182 | $387,500 | $61,900 | $325,600 |
| 2016 | $8,109 | $384,800 | $61,900 | $322,900 |
| 2015 | $7,933 | $376,123 | $61,904 | $314,219 |
| 2014 | $7,748 | $376,123 | $61,904 | $314,219 |
| 2013 | $7,576 | $376,123 | $61,904 | $314,219 |
Source: Public Records
Map
Nearby Homes
- 4725 Green Valley Dr SE
- 380 Indiandale Rd SE
- 3830 Skylark Ln SE
- 5029 Broadlawn Dr SE
- 2227 Kestrel Dr SE
- 2403 Kestrel Dr SE
- 2416 Kestrel Dr SE
- 2226 Kestrel Dr SE
- 3112 Peregrine Ct SE
- 2306 Kestrel Dr SE
- 2420 Kestrel Dr SE
- 2409 Kestrel Dr SE
- 2421 Kestrel Dr SE
- 2221 Kestrel Dr SE
- 2319 Kestrel Dr SE
- 2415 Kestrel Dr SE
- 2325 Kestrel Dr SE
- 2312 Kestrel Dr SE
- 3100 Peregrine Ct SE
- 2215 Kestrel Dr SE
- 308 Ashland Ct SE
- 302 Ashland Ct SE
- 312 Ashland Ct SE
- 303 Ashland Ct SE
- 307 Ashland Ct SE
- 305 Ashland Ct SE
- 315 Ashland Ct SE
- 316 Ashland Ct SE
- 311 Ashland Ct SE
- 306 Andover Ln SE
- 304 Andover Ln SE
- 308 Andover Ln SE
- 316 Andover Ln SE
- 370 Eastland Dr SE
- 320 Eastland Dr SE
- 397 Eastland Dr SE
- 211 E Post Rd SE
- 302 Andover Ln SE
- 454 Parkland Dr SE
- 223 E Post Rd SE