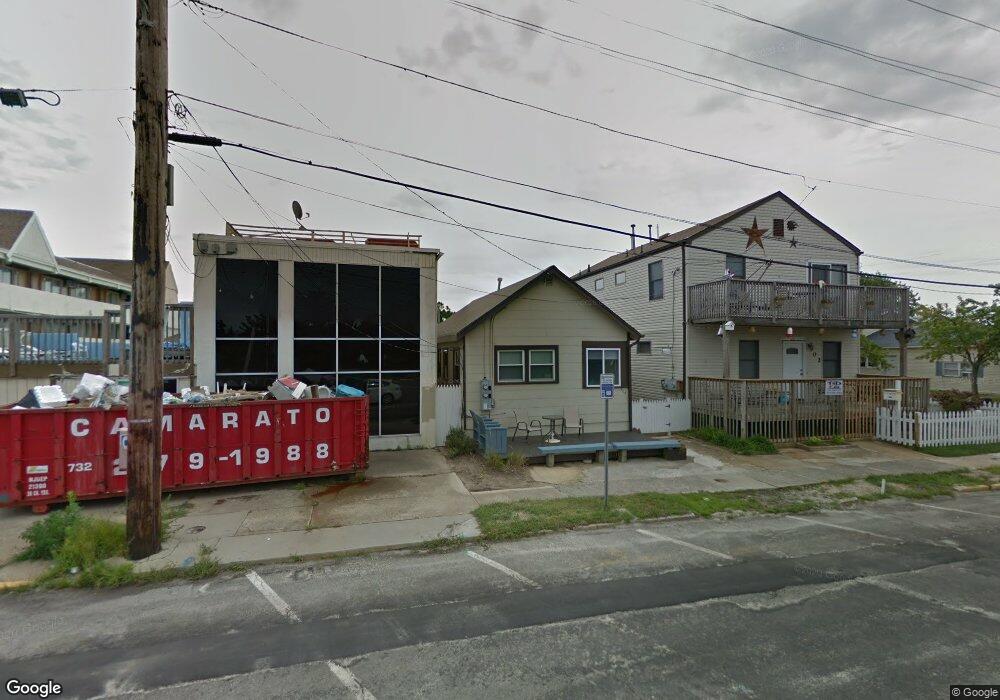
304 Bay Blvd Unit ANNUAL BACK Seaside Heights, NJ 08751
Estimated Value: $514,000 - $696,000
2
Beds
2
Baths
648
Sq Ft
$1,001/Sq Ft
Est. Value
About This Home
This home is located at 304 Bay Blvd Unit ANNUAL BACK, Seaside Heights, NJ 08751 and is currently estimated at $648,947, approximately $1,001 per square foot. 304 Bay Blvd Unit ANNUAL BACK is a home located in Ocean County with nearby schools including Hugh J. Boyd Jr. Elementary School, Central Regional Middle School, and Central Regional High School.
Ownership History
Date
Name
Owned For
Owner Type
Purchase Details
Closed on
Jul 10, 2023
Sold by
Seaside Bay Llc
Bought by
Mallampati Murali
Current Estimated Value
Home Financials for this Owner
Home Financials are based on the most recent Mortgage that was taken out on this home.
Original Mortgage
$440,300
Outstanding Balance
$429,640
Interest Rate
6.71%
Mortgage Type
New Conventional
Estimated Equity
$219,307
Purchase Details
Closed on
Apr 1, 2020
Sold by
Cronk Thomas F and Cronk Sharon A
Bought by
Seaside Bay Llc
Purchase Details
Closed on
May 13, 2009
Sold by
Giunta Joseph
Bought by
Cronk Thomas F and Cronk Sharon A
Home Financials for this Owner
Home Financials are based on the most recent Mortgage that was taken out on this home.
Original Mortgage
$130,000
Interest Rate
5.19%
Mortgage Type
Purchase Money Mortgage
Purchase Details
Closed on
Aug 5, 1999
Sold by
Failla Eugene R and Failla Maureen
Bought by
Giunta Joseph
Home Financials for this Owner
Home Financials are based on the most recent Mortgage that was taken out on this home.
Original Mortgage
$46,800
Interest Rate
7.65%
Mortgage Type
Purchase Money Mortgage
Create a Home Valuation Report for This Property
The Home Valuation Report is an in-depth analysis detailing your home's value as well as a comparison with similar homes in the area
Home Values in the Area
Average Home Value in this Area
Purchase History
| Date | Buyer | Sale Price | Title Company |
|---|---|---|---|
| Mallampati Murali | $629,000 | Old Republic Title | |
| Seaside Bay Llc | $206,000 | Rms Title Services Llc | |
| Cronk Thomas F | $210,000 | Old Republic National Title | |
| Giunta Joseph | $60,000 | -- |
Source: Public Records
Mortgage History
| Date | Status | Borrower | Loan Amount |
|---|---|---|---|
| Open | Mallampati Murali | $440,300 | |
| Previous Owner | Cronk Thomas F | $130,000 | |
| Previous Owner | Giunta Joseph | $46,800 |
Source: Public Records
Tax History Compared to Growth
Tax History
| Year | Tax Paid | Tax Assessment Tax Assessment Total Assessment is a certain percentage of the fair market value that is determined by local assessors to be the total taxable value of land and additions on the property. | Land | Improvement |
|---|---|---|---|---|
| 2025 | $5,464 | $557,000 | $387,500 | $169,500 |
| 2024 | $5,071 | $192,800 | $100,000 | $92,800 |
| 2023 | $4,822 | $192,800 | $100,000 | $92,800 |
| 2022 | $4,822 | $192,800 | $100,000 | $92,800 |
| 2021 | $3,521 | $192,800 | $100,000 | $92,800 |
| 2020 | $4,681 | $192,800 | $100,000 | $92,800 |
| 2019 | $4,540 | $192,800 | $100,000 | $92,800 |
| 2018 | $4,421 | $192,800 | $100,000 | $92,800 |
| 2017 | $4,338 | $192,800 | $100,000 | $92,800 |
| 2016 | $4,265 | $192,800 | $100,000 | $92,800 |
| 2015 | $4,116 | $192,800 | $100,000 | $92,800 |
| 2014 | $3,769 | $192,800 | $100,000 | $92,800 |
Source: Public Records
Map
Nearby Homes
- 322 Lincoln Ave
- 305 Franklin Ave
- 305 Hamilton Ave
- 303 Hamilton Ave
- 316 Hamilton Ave
- 321 Dupont Ave
- 313 Dupont Ave
- 309 Webster Ave
- 307 Webster Ave
- 301 Webster Ave
- 414 Bay Blvd Unit B
- 303 Webster Ave
- 214 Franklin Ave
- 8 Bay Blvd Unit 1
- 324 Webster Ave
- 223 Webster Ave Unit 2
- 235A Bay Terrace Unit A
- 235 Bay Terrace Unit A
- 224 Bay Terrace
- 111 Dupont Ave
- 304 Bay Blvd Unit Rear
- 304 Bay Blvd Unit Front
- 304 Bay Blvd
- 304 Bay Blvd Unit BACK
- 304 Bay Blvd Unit WINTER BACK
- 304 Bay Blvd Unit WINTER FRONT
- 302 Bay Blvd
- 302 Bay Blvd Unit 2
- 328 Franklin Ave
- 309 Bay Blvd
- 326 Franklin Ave
- 212 Bay Blvd Unit C
- 212 Bay Blvd Unit B
- 212 Bay Blvd Unit A
- 210 Bay Blvd
- 329 Franklin Ave
- 327 Franklin Ave
- 327 Franklin Ave Unit West Side
- 322 Franklin Ave
- 323 Franklin Ave