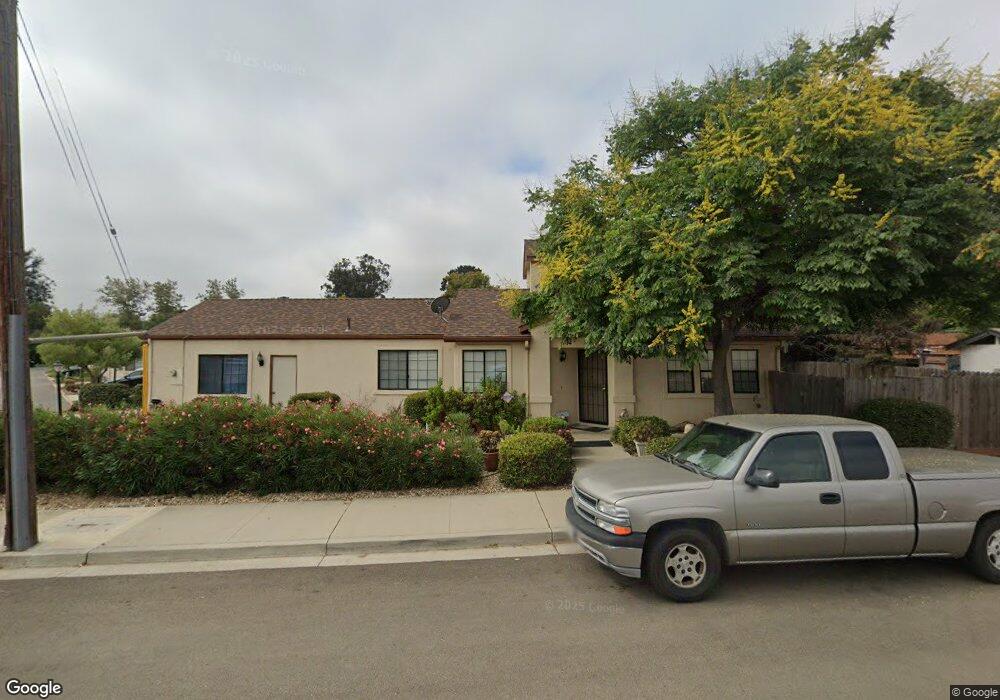
304 Blue Springs Ln Nipomo, CA 93444
Estimated Value: $533,000 - $604,000
3
Beds
2
Baths
1,454
Sq Ft
$392/Sq Ft
Est. Value
About This Home
This home is located at 304 Blue Springs Ln, Nipomo, CA 93444 and is currently estimated at $570,411, approximately $392 per square foot. 304 Blue Springs Ln is a home located in San Luis Obispo County with nearby schools including Nipomo Elementary School, Mesa Middle School, and Nipomo High School.
Create a Home Valuation Report for This Property
The Home Valuation Report is an in-depth analysis detailing your home's value as well as a comparison with similar homes in the area
Home Values in the Area
Average Home Value in this Area
Tax History Compared to Growth
Tax History
| Year | Tax Paid | Tax Assessment Tax Assessment Total Assessment is a certain percentage of the fair market value that is determined by local assessors to be the total taxable value of land and additions on the property. | Land | Improvement |
|---|---|---|---|---|
| 2025 | $2,183 | $212,253 | $76,466 | $135,787 |
| 2024 | $2,158 | $208,092 | $74,967 | $133,125 |
| 2023 | $2,158 | $204,013 | $73,498 | $130,515 |
| 2022 | $2,126 | $200,013 | $72,057 | $127,956 |
| 2021 | $2,122 | $196,093 | $70,645 | $125,448 |
| 2020 | $2,098 | $194,083 | $69,921 | $124,162 |
| 2019 | $2,085 | $190,278 | $68,550 | $121,728 |
| 2018 | $2,060 | $186,548 | $67,206 | $119,342 |
| 2017 | $2,021 | $182,891 | $65,889 | $117,002 |
| 2016 | $1,906 | $179,306 | $64,598 | $114,708 |
| 2015 | $1,879 | $176,613 | $63,628 | $112,985 |
| 2014 | $1,809 | $173,154 | $62,382 | $110,772 |
Source: Public Records
Map
Nearby Homes
- 90111003 W Price St
- 449 W Tefft St Unit 23
- 449 W Tefft St Unit 13
- 160 San Antonio Ln
- 0 S Burton St
- 1 W Branch St
- 400 N Oakglen Ave
- 525 Grande Ave Unit D
- 150 E Chestnut St
- 189 E Tefft St
- 368 Avenida de Amigos
- 412 N Mallagh St
- 450 Avenida de Socios Unit 12
- Mesa Plan at Hill Street Terraces - Hill Street Series
- Pacific Plan at Hill Street Terraces - Hill Street Series
- Monarch Plan at Hill Street Terraces - Hill Street Series
- Rancho Plan at Hill Street Terraces - Hill Street Series
- Dana Plan at Hill Street Terraces - Hill Street Series
- 680 Hill St
- 232 Scarlett Cir
- 308 Blue Springs
- 308 Blue Springs Ln
- 141 Clearwater Ln
- 312 Blue Springs Ln
- 137 Clearwater Ln
- 145 Clearwater Ln
- 307 Blue Springs Ln
- 316 Blue Springs Ln
- 316 Blue Springs
- 303 Blue Springs Ln
- 149 Clearwater Ln
- 311 Blue Springs Ln
- 320 Blue Springs Ln
- 311 Blue Springs
- 160 Carrillo St
- 153 Clearwater Ln
- 323 W Tefft St
- 324 Blue Springs Ln
- 136 Clearwater Ln
- 164 Carrillo St