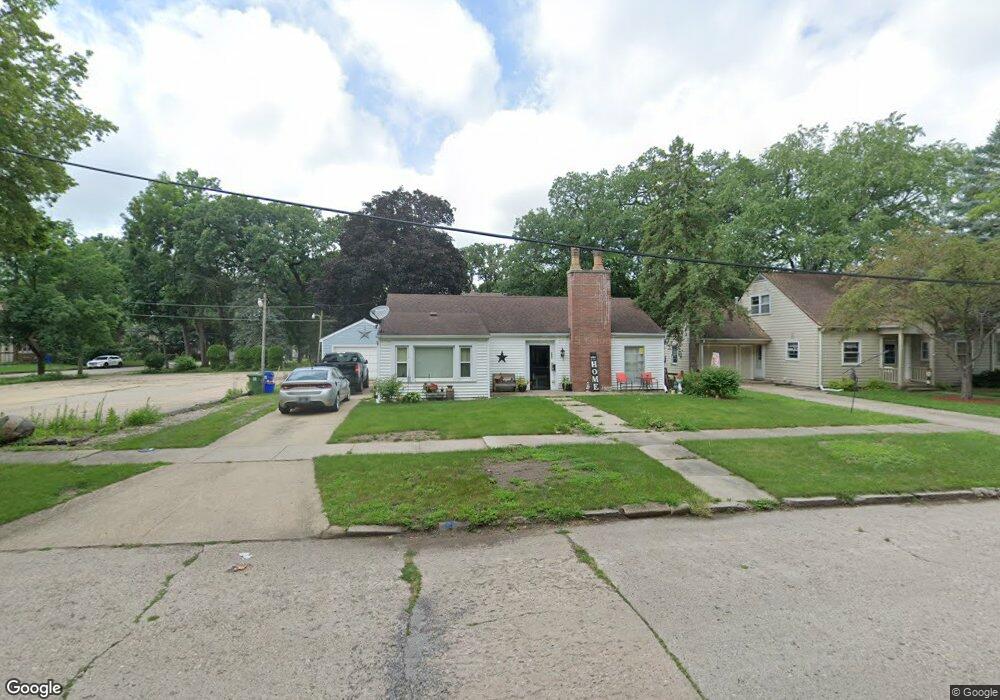
304 Blunt St Charles City, IA 50616
Estimated Value: $97,000 - $121,000
2
Beds
1
Bath
1,092
Sq Ft
$99/Sq Ft
Est. Value
About This Home
This home is located at 304 Blunt St, Charles City, IA 50616 and is currently estimated at $107,601, approximately $98 per square foot. 304 Blunt St is a home located in Floyd County with nearby schools including Charles City High School and Immaculate Conception School.
Ownership History
Date
Name
Owned For
Owner Type
Purchase Details
Closed on
Jun 9, 2021
Sold by
Carey Tenna L
Bought by
Carey Kimberly Jean
Current Estimated Value
Home Financials for this Owner
Home Financials are based on the most recent Mortgage that was taken out on this home.
Original Mortgage
$72,000
Outstanding Balance
$65,187
Interest Rate
2.9%
Mortgage Type
New Conventional
Estimated Equity
$42,414
Purchase Details
Closed on
Jul 18, 2013
Sold by
Cave Jane A
Bought by
Carey Tenna L
Home Financials for this Owner
Home Financials are based on the most recent Mortgage that was taken out on this home.
Original Mortgage
$75,510
Interest Rate
4.02%
Mortgage Type
New Conventional
Create a Home Valuation Report for This Property
The Home Valuation Report is an in-depth analysis detailing your home's value as well as a comparison with similar homes in the area
Home Values in the Area
Average Home Value in this Area
Purchase History
| Date | Buyer | Sale Price | Title Company |
|---|---|---|---|
| Carey Kimberly Jean | $72,000 | None Listed On Document | |
| Carey Tenna L | $74,000 | None Available |
Source: Public Records
Mortgage History
| Date | Status | Borrower | Loan Amount |
|---|---|---|---|
| Open | Carey Kimberly Jean | $72,000 | |
| Previous Owner | Carey Tenna L | $75,510 |
Source: Public Records
Tax History Compared to Growth
Tax History
| Year | Tax Paid | Tax Assessment Tax Assessment Total Assessment is a certain percentage of the fair market value that is determined by local assessors to be the total taxable value of land and additions on the property. | Land | Improvement |
|---|---|---|---|---|
| 2024 | $1,580 | $98,950 | $15,840 | $83,110 |
| 2023 | $1,542 | $98,950 | $15,840 | $83,110 |
| 2022 | $1,452 | $81,980 | $15,840 | $66,140 |
| 2021 | $1,634 | $78,090 | $15,840 | $62,250 |
| 2020 | $1,634 | $85,880 | $15,840 | $70,040 |
| 2019 | $1,202 | $70,040 | $14,260 | $55,780 |
| 2018 | $1,118 | $64,980 | $14,260 | $50,720 |
| 2017 | $1,152 | $64,980 | $14,260 | $50,720 |
| 2016 | $1,128 | $64,980 | $14,260 | $50,720 |
| 2015 | $1,128 | $65,350 | $14,260 | $51,090 |
| 2014 | $1,154 | $65,350 | $14,260 | $51,090 |
Source: Public Records
Map
Nearby Homes
- 107 Baldwin St
- 124 Cedar Cir
- 306 S Johnson St
- 501 Freeman St
- 600 Freeman St
- 602 S Iowa St
- 709 S Johnson St
- 1603 Ohio Ave
- 507 3rd Ave
- 304 6th St
- 1007 Cedar St
- 812 8th St
- 2628 195th St Unit Lot 7
- 2626 195th St Unit Lot 6
- 2622 195th St Unit Lot 5
- 806 Parkside Ln
- 808 Parkside Ln
- 810 Parkside Ln
- 1107 Freeman St
- 204 8th St