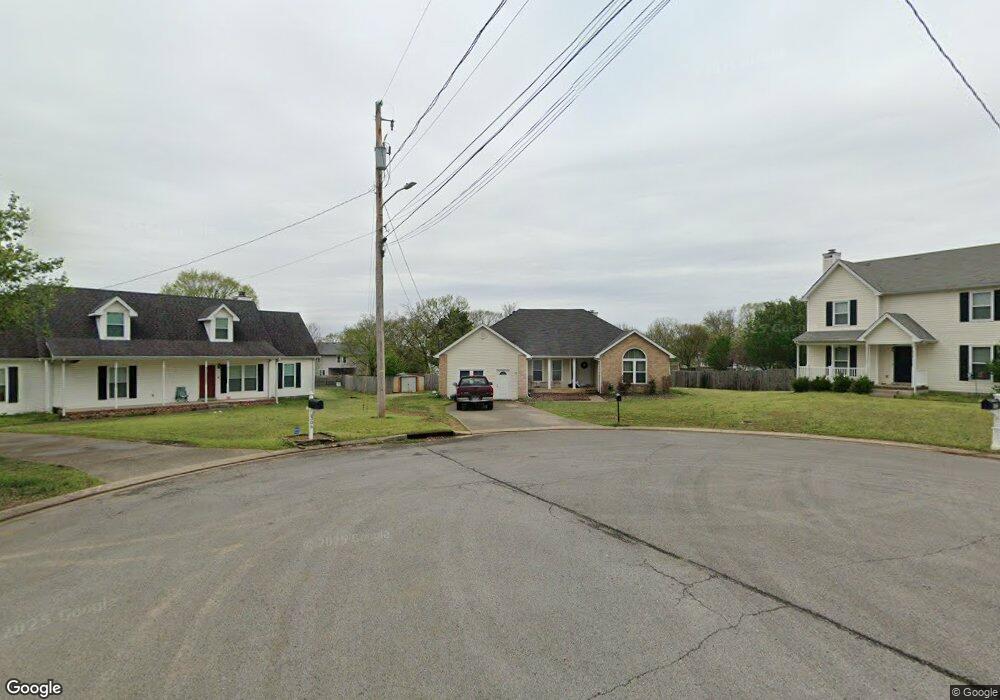
304 Brent Cove La Vergne, TN 37086
Estimated Value: $346,848 - $426,000
--
Bed
3
Baths
2,130
Sq Ft
$184/Sq Ft
Est. Value
About This Home
This home is located at 304 Brent Cove, La Vergne, TN 37086 and is currently estimated at $391,462, approximately $183 per square foot. 304 Brent Cove is a home located in Rutherford County with nearby schools including LaVergne Lake Elementary School, La Vergne Middle School, and Lavergne High School.
Ownership History
Date
Name
Owned For
Owner Type
Purchase Details
Closed on
Aug 23, 1994
Sold by
Holigan Family Investments
Bought by
Holigan Homes Inc
Current Estimated Value
Purchase Details
Closed on
Aug 5, 1994
Sold by
Shreibman Amnon Trustee
Bought by
Holigan Family Investments
Create a Home Valuation Report for This Property
The Home Valuation Report is an in-depth analysis detailing your home's value as well as a comparison with similar homes in the area
Home Values in the Area
Average Home Value in this Area
Purchase History
| Date | Buyer | Sale Price | Title Company |
|---|---|---|---|
| Holigan Homes Inc | -- | -- | |
| Holigan Family Investments | -- | -- |
Source: Public Records
Tax History Compared to Growth
Tax History
| Year | Tax Paid | Tax Assessment Tax Assessment Total Assessment is a certain percentage of the fair market value that is determined by local assessors to be the total taxable value of land and additions on the property. | Land | Improvement |
|---|---|---|---|---|
| 2025 | $1,931 | $80,075 | $13,750 | $66,325 |
| 2024 | $1,931 | $78,525 | $13,750 | $64,775 |
| 2023 | $1,473 | $78,525 | $13,750 | $64,775 |
| 2022 | $1,269 | $78,525 | $13,750 | $64,775 |
| 2021 | $1,260 | $56,775 | $10,000 | $46,775 |
| 2020 | $1,260 | $56,775 | $10,000 | $46,775 |
| 2019 | $1,260 | $56,775 | $10,000 | $46,775 |
| 2018 | $1,595 | $56,775 | $0 | $0 |
| 2017 | $1,326 | $36,525 | $0 | $0 |
| 2016 | $1,326 | $36,525 | $0 | $0 |
| 2015 | $1,335 | $36,525 | $0 | $0 |
| 2014 | $908 | $36,525 | $0 | $0 |
| 2013 | -- | $34,875 | $0 | $0 |
Source: Public Records
Map
Nearby Homes
- 507 Jerald Smith Ln
- 607 Mable Dr
- 396 Davids Way
- 800 Troy Cove
- 733 Hollandale Rd
- 166 Oasis Dr
- 160 Oasis Dr
- 164 Oasis Dr
- 154 Oasis Dr
- 1529 Waxman Dr
- 1610 Jo Ann Dr
- 101 Kalman Minuskin Blvd
- 618 Cedar Bend Ln
- 699 Hollandale Rd
- 303 Holland Ridge Dr
- 303 Amit St
- 1710 Chris Dr
- 1626 Jo Ann Dr
- 605 Hollandale Rd
- 603 Hollandale Rd
- 302 Brent Cove
- 711 Little John Cove
- 306 Brent Cove
- 494 Forest Ridge Dr
- 496 Forest Ridge Dr
- 307 Brent Cove
- 710 Little John Cove
- 709 Little John Cove
- 492 Forest Ridge Dr
- 498 Forest Ridge Dr
- 305 Brent Cove
- 417 Randall Ln
- 490 Forest Ridge Dr
- 419 Randall Ln
- 415 Randall Ln
- 708 Little John Cove
- 303 Brent Cove
- 423 Randall Ln
- 425 Randall Ln
- 488 Forest Ridge Dr