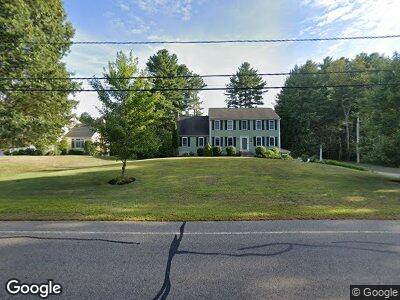
304 Cedar St Hanover, MA 02339
Estimated Value: $1,016,000 - $1,210,000
4
Beds
4
Baths
2,770
Sq Ft
$407/Sq Ft
Est. Value
About This Home
This home is located at 304 Cedar St, Hanover, MA 02339 and is currently estimated at $1,127,431, approximately $407 per square foot. 304 Cedar St is a home located in Plymouth County with nearby schools including Hanover High School and The Master's Academy.
Ownership History
Date
Name
Owned For
Owner Type
Purchase Details
Closed on
Aug 20, 2013
Sold by
Quagliariello Richard S and Quagliariello Kristen L
Bought by
K L Quagliariello Lt and Quagliariello K L
Current Estimated Value
Purchase Details
Closed on
Dec 1, 2009
Sold by
Mortland Lance and Mortland Shirley A
Bought by
Quagliariel Richard Scott and Quagliariel Kristen Lynne
Home Financials for this Owner
Home Financials are based on the most recent Mortgage that was taken out on this home.
Original Mortgage
$459,000
Interest Rate
4.92%
Mortgage Type
Purchase Money Mortgage
Purchase Details
Closed on
Apr 25, 2002
Sold by
1-4 Cedar St Rt and Bradley John G
Bought by
Mortland Lance and Mortland Shirley A
Create a Home Valuation Report for This Property
The Home Valuation Report is an in-depth analysis detailing your home's value as well as a comparison with similar homes in the area
Home Values in the Area
Average Home Value in this Area
Purchase History
| Date | Buyer | Sale Price | Title Company |
|---|---|---|---|
| K L Quagliariello Lt | -- | -- | |
| Quagliariel Richard Scott | $540,000 | -- | |
| Mortland Lance | $499,900 | -- |
Source: Public Records
Mortgage History
| Date | Status | Borrower | Loan Amount |
|---|---|---|---|
| Open | Kristen Quagliariello Lt | $300,000 | |
| Closed | Quagliariello Kristen | $100,000 | |
| Previous Owner | Quagliariello Richard S | $447,000 | |
| Previous Owner | Mortland Lance | $459,000 | |
| Previous Owner | Mortland Lance | $459,000 | |
| Previous Owner | Mortland Lance | $40,000 |
Source: Public Records
Tax History Compared to Growth
Tax History
| Year | Tax Paid | Tax Assessment Tax Assessment Total Assessment is a certain percentage of the fair market value that is determined by local assessors to be the total taxable value of land and additions on the property. | Land | Improvement |
|---|---|---|---|---|
| 2025 | $12,171 | $985,500 | $306,400 | $679,100 |
| 2024 | $11,840 | $922,100 | $306,400 | $615,700 |
| 2023 | $11,241 | $833,300 | $281,100 | $552,200 |
| 2022 | $11,242 | $737,200 | $268,400 | $468,800 |
| 2021 | $10,899 | $667,400 | $223,300 | $444,100 |
| 2020 | $10,773 | $660,500 | $234,900 | $425,600 |
| 2019 | $9,976 | $607,900 | $234,900 | $373,000 |
| 2018 | $670 | $571,300 | $234,900 | $336,400 |
| 2017 | $9,136 | $553,000 | $229,700 | $323,300 |
| 2016 | $8,889 | $527,200 | $211,100 | $316,100 |
| 2015 | $8,293 | $513,500 | $197,400 | $316,100 |
Source: Public Records
Map
Nearby Homes