Estimated Value: $277,646 - $361,000
--
Bed
3
Baths
1,989
Sq Ft
$163/Sq Ft
Est. Value
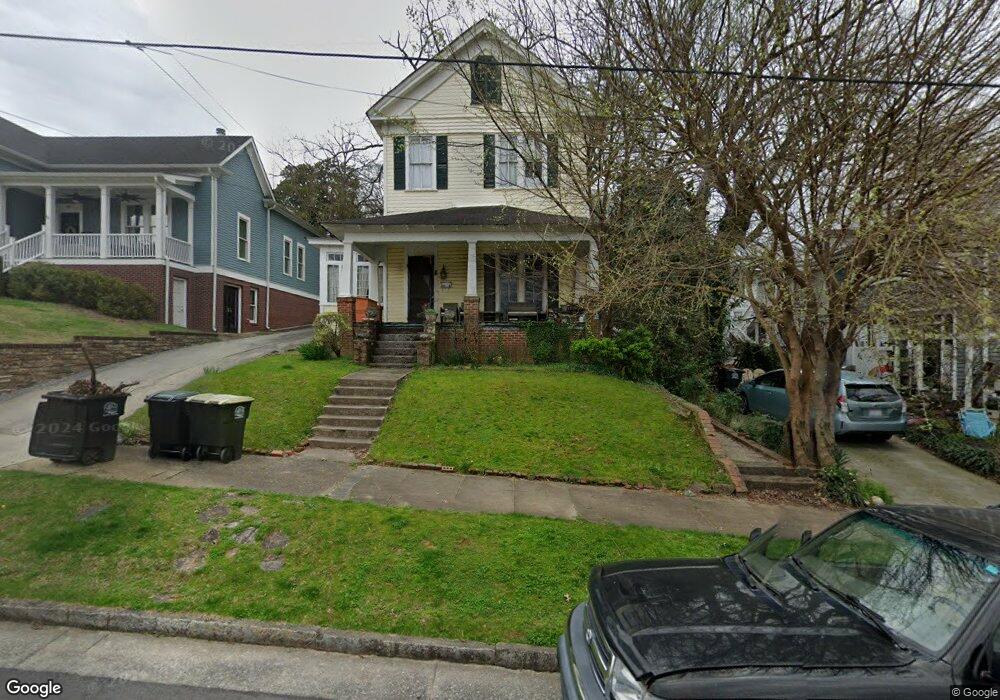
About This Home
This home is located at 304 E 2nd St, Rome, GA 30161 and is currently estimated at $325,162, approximately $163 per square foot. 304 E 2nd St is a home located in Floyd County with nearby schools including Rome High School, St. Mary School, and Darlington School.
Ownership History
Date
Name
Owned For
Owner Type
Purchase Details
Closed on
Sep 8, 2005
Bought by
P and R
Current Estimated Value
Purchase Details
Closed on
Nov 26, 2001
Sold by
Hall Tiffany D and Blackwell Heather A
Bought by
Blackwell Heather A
Purchase Details
Closed on
Jan 30, 1998
Sold by
Hall Tiffany D
Bought by
Hall Tiffany D and Blackwel Heather A
Purchase Details
Closed on
Jun 2, 1989
Sold by
Ridenour
Bought by
Dent Charles Fredrick and Julia Hilbu
Purchase Details
Closed on
May 9, 1985
Sold by
Atha William J and Atha Vivian B
Bought by
Ridenour James F and Ridenour Doris M
Purchase Details
Closed on
Sep 30, 1981
Sold by
Hine Edward
Bought by
Atha William J and Atha Vivian B
Purchase Details
Closed on
Jul 28, 1980
Sold by
Pine Log Land Co
Bought by
Hine Edward
Purchase Details
Closed on
Oct 27, 1977
Sold by
Ledbetter Rebecca B
Bought by
Pine Log Land Co
Purchase Details
Closed on
May 25, 1972
Sold by
Ledbetter W T Mrs
Bought by
Ledbetter Rebecca B
Purchase Details
Closed on
Jun 8, 1948
Bought by
Ledbetter W T Mrs
Create a Home Valuation Report for This Property
The Home Valuation Report is an in-depth analysis detailing your home's value as well as a comparison with similar homes in the area
Home Values in the Area
Average Home Value in this Area
Purchase History
| Date | Buyer | Sale Price | Title Company |
|---|---|---|---|
| P | $225,000 | -- | |
| Blackwell Heather A | $18,400 | -- | |
| Hall Tiffany D | -- | -- | |
| Hall Tiffany D | $70,300 | -- | |
| Dent Charles Fredrick | -- | -- | |
| Ridenour James F | $55,500 | -- | |
| Ridenour | -- | -- | |
| Atha William J | $36,800 | -- | |
| Hine Edward | $32,000 | -- | |
| Pine Log Land Co | -- | -- | |
| Ledbetter Rebecca B | $8,000 | -- | |
| Ledbetter W T Mrs | -- | -- |
Source: Public Records
Tax History
| Year | Tax Paid | Tax Assessment Tax Assessment Total Assessment is a certain percentage of the fair market value that is determined by local assessors to be the total taxable value of land and additions on the property. | Land | Improvement |
|---|---|---|---|---|
| 2025 | $3,635 | $101,676 | $11,950 | $89,726 |
| 2024 | $3,635 | $93,526 | $10,864 | $82,662 |
| 2023 | $2,144 | $88,908 | $9,778 | $79,130 |
| 2022 | $1,939 | $73,071 | $8,070 | $65,001 |
| 2021 | $1,845 | $66,047 | $8,070 | $57,977 |
| 2020 | $1,761 | $60,612 | $6,208 | $54,404 |
| 2019 | $1,687 | $57,080 | $6,208 | $50,872 |
| 2018 | $1,626 | $53,588 | $6,208 | $47,380 |
| 2017 | $1,588 | $51,436 | $6,208 | $45,228 |
| 2016 | $1,567 | $50,000 | $6,200 | $43,800 |
| 2015 | $1,380 | $50,000 | $6,200 | $43,800 |
| 2014 | $1,380 | $43,511 | $4,640 | $38,871 |
Source: Public Records
Map
Nearby Homes
- 202 E 4th Ave Unit 5
- 312 E 3rd St
- 214 E 3rd St
- 10 E 3rd Ave
- 8 E 3rd Ave
- 407 E 3rd St
- 1 E 3rd Ave Unit 302
- 501 E 3rd St
- 320 E 3rd Ave
- 29 Pear St
- 633 E 3rd St
- 167 Sweet Water Ln
- 0 Brook Valley Ct Unit 10665224
- 0 Brook Valley Ct Unit 7698646
- 138 E 8th Ave Unit 25
- 232 S Broad St SW
- 105 Mary St SW
- 2 Coral Ave SW
- 102 Smith St NE
- 715 Avenue A NE
- 308 E 2nd St
- 203 E 3rd Ave
- 201 E 3rd Ave
- 207 E 3rd Ave
- 311 E 3rd St
- 350 E 2nd St
- 200 E 4th Ave
- 202 E 4th Ave
- 202 E 4th Ave Unit 1
- 202 E 4th Ave Unit 4
- 202 E 4th Ave Unit 3
- E E 3rd St Unit 14
- E E 3rd St Unit 150
- E E 3rd St
- 300 E 3rd St
- 340 E 3rd St
- 13 College Ave
- 206 E 4th Ave
- 17 College Ave
- 245 E 2nd St
Your Personal Tour Guide
Ask me questions while you tour the home.