304 E 3rd St Chadwick, IL 61014
Estimated Value: $120,000 - $173,000
3
Beds
2
Baths
1,512
Sq Ft
$94/Sq Ft
Est. Value
About This Home
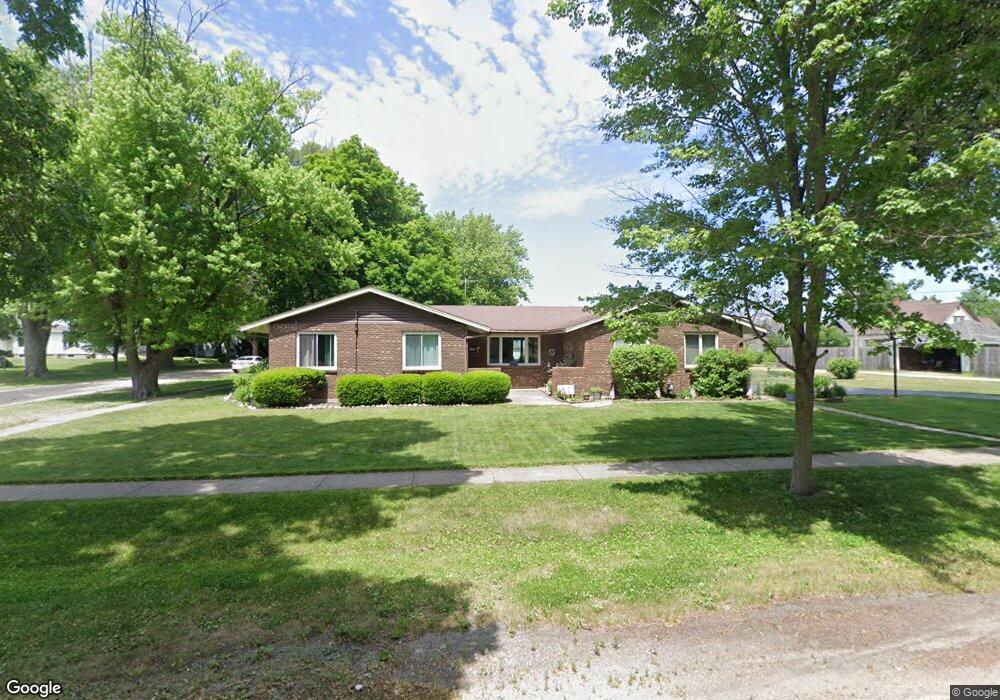
This home is located at 304 E 3rd St, Chadwick, IL 61014 and is currently estimated at $142,352, approximately $94 per square foot. 304 E 3rd St is a home located in Carroll County with nearby schools including Chadwick-Milledgeville Elementary School and Chadwick-Milledgeville School.
Create a Home Valuation Report for This Property
The Home Valuation Report is an in-depth analysis detailing your home's value as well as a comparison with similar homes in the area
Tax History
| Year | Tax Paid | Tax Assessment Tax Assessment Total Assessment is a certain percentage of the fair market value that is determined by local assessors to be the total taxable value of land and additions on the property. | Land | Improvement |
|---|---|---|---|---|
| 2024 | $3,165 | $41,839 | $2,450 | $39,389 |
| 2023 | $3,165 | $41,839 | $2,450 | $39,389 |
| 2022 | $3,222 | $41,839 | $2,450 | $39,389 |
| 2021 | $3,193 | $40,986 | $2,450 | $38,536 |
| 2020 | $3,203 | $40,986 | $2,450 | $38,536 |
| 2019 | $3,221 | $40,986 | $2,450 | $38,536 |
| 2018 | $3,661 | $40,986 | $2,450 | $38,536 |
| 2017 | $3,636 | $41,449 | $2,450 | $38,999 |
| 2016 | $3,641 | $41,449 | $2,450 | $38,999 |
| 2015 | $3,613 | $41,449 | $2,450 | $38,999 |
| 2014 | $3,421 | $41,449 | $2,450 | $38,999 |
| 2013 | $3,421 | $41,773 | $1,750 | $40,023 |
Source: Public Records
Map
Nearby Homes
- 503 N Main St
- 27375 Illinois 40
- 3990 School Rd
- 24231 Wysox Rd
- 27754 Elm Rd
- 205 Illinois 64
- 515 Hill St
- 710 Otter Creek Dr
- 108 SW Lanark Ave
- 108 SW Lanark Ave Unit 110 SW Lanark Avenue
- 23633 Carroll Rd
- 500 N Main Ave
- 328 E Carroll St
- 102 E 6th St
- 629 E Locust St
- 305 Holcomb Ave
- 115 N Clay St
- 20-31 & 32 Fox Run Dr
- 3-499 Shady Ln
- 13-143 Newberry Ct
Your Personal Tour Guide
Ask me questions while you tour the home.