Estimated Value: $281,153 - $330,000
--
Bed
2
Baths
1,946
Sq Ft
$157/Sq Ft
Est. Value
About This Home
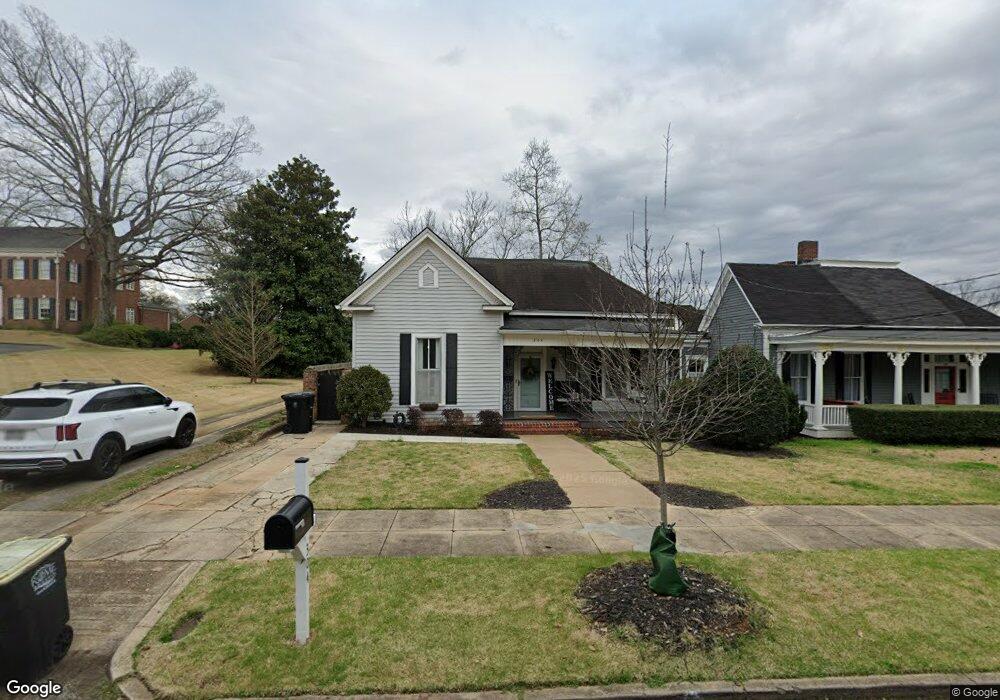
This home is located at 304 E 4th St, Rome, GA 30161 and is currently estimated at $305,288, approximately $156 per square foot. 304 E 4th St is a home located in Floyd County with nearby schools including Rome High School, St. Mary School, and Darlington School.
Ownership History
Date
Name
Owned For
Owner Type
Purchase Details
Closed on
Oct 24, 2006
Sold by
Not Provided
Bought by
Walstad Martha B
Current Estimated Value
Purchase Details
Closed on
Nov 5, 1996
Sold by
Berry Mirtica R
Bought by
Berry Tom and Jane Berry
Purchase Details
Closed on
Dec 18, 1986
Sold by
Cameron Richard A and Cameron Gloria M
Bought by
Berry Mirtica R
Purchase Details
Closed on
Sep 14, 1981
Sold by
Jones Joel and Self William S
Bought by
Cameron Richard A and Cameron Gloria M
Purchase Details
Closed on
Jul 16, 1981
Sold by
Munchak Theodore J
Bought by
Jones Joel and Self William S
Purchase Details
Closed on
Oct 13, 1977
Sold by
Ginz Frank C and Ginz Beatrice
Bought by
Munchak Theodore J
Purchase Details
Closed on
Nov 14, 1975
Sold by
Mann Becky Rish
Bought by
Ginz Frank C and Ginz Beatrice
Purchase Details
Closed on
May 12, 1972
Sold by
Rish Elizabeth G
Bought by
Mann Becky Rish
Purchase Details
Closed on
May 23, 1955
Bought by
Rish Elizabeth G
Create a Home Valuation Report for This Property
The Home Valuation Report is an in-depth analysis detailing your home's value as well as a comparison with similar homes in the area
Home Values in the Area
Average Home Value in this Area
Purchase History
| Date | Buyer | Sale Price | Title Company |
|---|---|---|---|
| Walstad Martha B | $125,000 | -- | |
| Berry Tom | -- | -- | |
| Berry Mirtica R | $48,000 | -- | |
| Cameron Richard A | $46,000 | -- | |
| Jones Joel | $40,100 | -- | |
| Munchak Theodore J | $46,000 | -- | |
| Ginz Frank C | $43,500 | -- | |
| Mann Becky Rish | -- | -- | |
| Rish Elizabeth G | -- | -- |
Source: Public Records
Tax History
| Year | Tax Paid | Tax Assessment Tax Assessment Total Assessment is a certain percentage of the fair market value that is determined by local assessors to be the total taxable value of land and additions on the property. | Land | Improvement |
|---|---|---|---|---|
| 2025 | $3,868 | $108,191 | $13,065 | $95,126 |
| 2024 | $3,868 | $99,777 | $11,878 | $87,899 |
| 2023 | $3,534 | $95,016 | $10,690 | $84,326 |
| 2022 | $2,873 | $78,736 | $8,823 | $69,913 |
| 2021 | $2,653 | $71,509 | $8,823 | $62,686 |
| 2020 | $2,464 | $65,860 | $6,787 | $59,073 |
| 2019 | $2,306 | $62,287 | $6,787 | $55,500 |
| 2018 | $2,172 | $58,674 | $6,787 | $51,887 |
| 2017 | $2,093 | $56,522 | $6,787 | $49,735 |
| 2016 | $2,042 | $55,000 | $6,760 | $48,240 |
| 2015 | $1,700 | $55,000 | $6,760 | $48,240 |
| 2014 | $1,700 | $48,470 | $5,080 | $43,390 |
Source: Public Records
Map
Nearby Homes
- 320 E 3rd Ave
- 312 E 3rd St
- 214 E 3rd St
- 202 E 4th Ave Unit 5
- 29 Pear St
- 407 E 3rd St
- 204 E 5th Ave
- 501 E 3rd St
- 10 E 3rd Ave
- 8 E 3rd Ave
- 1 E 3rd Ave Unit 302
- 1 E 3rd Ave
- 633 E 3rd St
- 138 E 8th Ave Unit 25
- 2 Coral Ave SW
- 0 Brook Valley Ct Unit 10665224
- 0 Brook Valley Ct Unit 7698646
- 167 Sweet Water Ln
- 801 Maple Ave SW
- 311 Roswell Ave SE
Your Personal Tour Guide
Ask me questions while you tour the home.