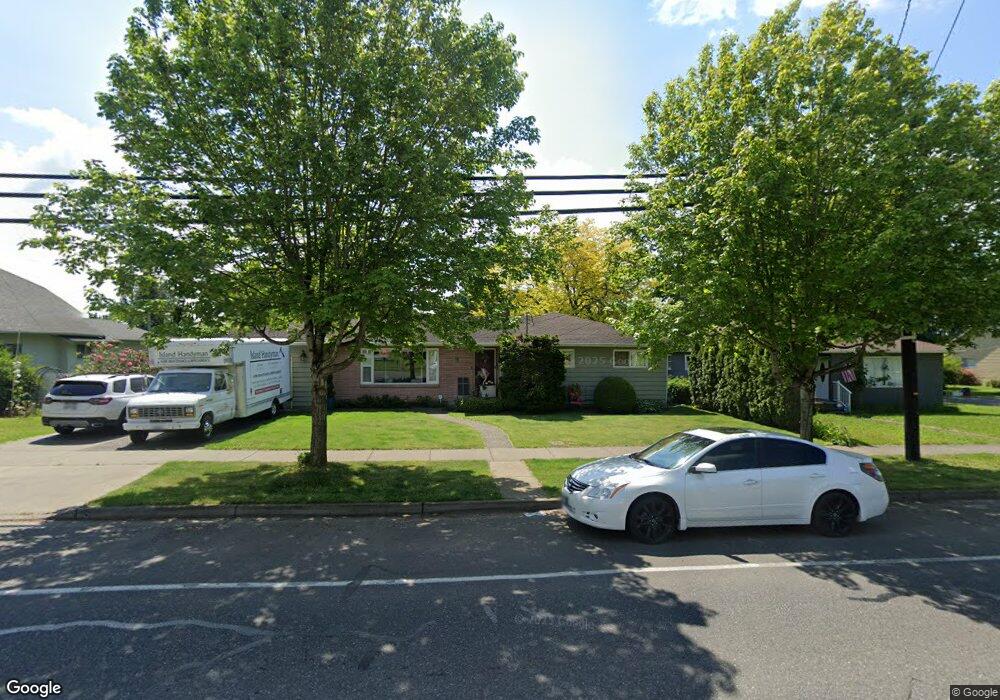
304 E Grover St Lynden, WA 98264
Estimated Value: $544,000 - $596,000
3
Beds
2
Baths
2,462
Sq Ft
$231/Sq Ft
Est. Value
About This Home
This home is located at 304 E Grover St, Lynden, WA 98264 and is currently estimated at $568,011, approximately $230 per square foot. 304 E Grover St is a home located in Whatcom County with nearby schools including Lynden High School, Lynden Christian School, and Lynden Christian Schools: Administration.
Ownership History
Date
Name
Owned For
Owner Type
Purchase Details
Closed on
Jun 23, 2010
Sold by
Deregt Gerben E and Deregt Kate M
Bought by
Alanis Vera Emma and Gallegos Kimberly
Current Estimated Value
Home Financials for this Owner
Home Financials are based on the most recent Mortgage that was taken out on this home.
Original Mortgage
$264,248
Outstanding Balance
$175,791
Interest Rate
4.82%
Mortgage Type
New Conventional
Estimated Equity
$392,220
Purchase Details
Closed on
May 9, 2001
Sold by
Stadt Ruth A and Korthuis Ronald J
Bought by
Deregt Gerben E and Deregt Kate M
Home Financials for this Owner
Home Financials are based on the most recent Mortgage that was taken out on this home.
Original Mortgage
$108,400
Interest Rate
7.03%
Purchase Details
Closed on
Nov 30, 1999
Sold by
Korthuis John
Bought by
Korthuis Ronald J and Robert Korthuis D
Create a Home Valuation Report for This Property
The Home Valuation Report is an in-depth analysis detailing your home's value as well as a comparison with similar homes in the area
Home Values in the Area
Average Home Value in this Area
Purchase History
| Date | Buyer | Sale Price | Title Company |
|---|---|---|---|
| Alanis Vera Emma | $255,280 | Chicago Title Insurance | |
| Deregt Gerben E | $135,500 | First American Title Insuran | |
| Korthuis Ronald J | -- | -- |
Source: Public Records
Mortgage History
| Date | Status | Borrower | Loan Amount |
|---|---|---|---|
| Open | Alanis Vera Emma | $264,248 | |
| Previous Owner | Deregt Gerben E | $108,400 | |
| Closed | Deregt Gerben E | $20,325 |
Source: Public Records
Tax History Compared to Growth
Tax History
| Year | Tax Paid | Tax Assessment Tax Assessment Total Assessment is a certain percentage of the fair market value that is determined by local assessors to be the total taxable value of land and additions on the property. | Land | Improvement |
|---|---|---|---|---|
| 2024 | $3,769 | $529,139 | $218,250 | $310,889 |
| 2023 | $3,769 | $523,932 | $225,000 | $298,932 |
| 2022 | $3,369 | $441,907 | $135,383 | $306,524 |
| 2021 | $3,305 | $365,208 | $111,885 | $253,323 |
| 2020 | $2,895 | $326,087 | $99,900 | $226,187 |
| 2019 | $2,576 | $299,063 | $91,725 | $207,338 |
| 2018 | $2,815 | $272,743 | $83,558 | $189,185 |
| 2017 | $2,617 | $244,810 | $75,000 | $169,810 |
| 2016 | $2,471 | $242,037 | $74,800 | $167,237 |
| 2015 | $2,191 | $227,252 | $71,944 | $155,308 |
| 2014 | -- | $219,552 | $69,496 | $150,056 |
| 2013 | -- | $218,056 | $68,000 | $150,056 |
Source: Public Records
Map
Nearby Homes
- 211 Maple St
- 607 E Front St
- 126 E Grover St Unit 6
- 209 Liberty St
- 208 Skipping Stone Loop
- 214 Skipping Stone Loop
- 202 Skipping Stone Loop
- 215 Skipping Stone Loop
- 204 Skipping Stone Loop
- 220 Skipping Stone Loop
- 208 Riverwalk Dr
- 102 Riverwalk Dr
- 116 Riverwalk Dr
- 104 Riverwalk Dr
- 205 Riverwalk Dr
- 231 Skipping Stone Loop
- 205 Pebblebrook Dr
- 204 Pebblebrook Dr
- 207 Pebblebrook Dr
- 211 Pebblebrook Dr
- 300 E Grover St
- 314 E Grover St
- 303 E Front St
- 307 E Front St
- 305 E Grover St
- 215 E Front St
- 402 E Grover St
- 309 E Front St
- 315 E Grover St
- 301 E Grover St
- 401 E Grover St
- 406 E Grover St
- 213 E Grover St
- 106 Hawley St
- 209 E Grover St
- 100 Hawley St
- 200 E Grover St
- 412 E Grover St
- 411 E Front St
- 414 E Grover St