304 Locust Ln Lexington, TN 38351
Estimated Value: $324,000 - $439,000
--
Bed
3
Baths
1,747
Sq Ft
$210/Sq Ft
Est. Value
About This Home
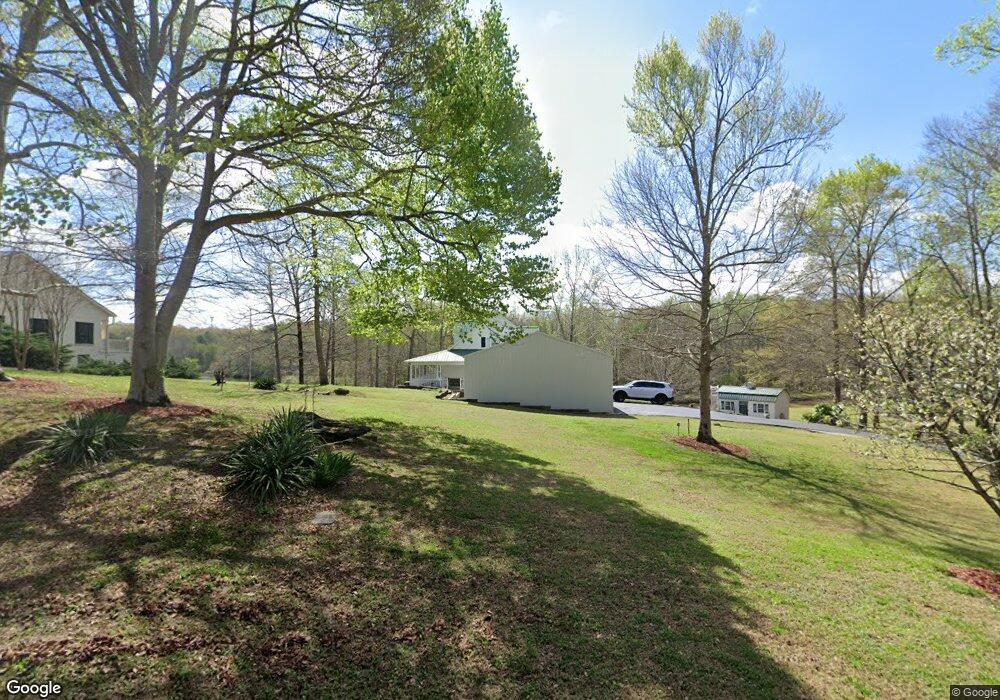
This home is located at 304 Locust Ln, Lexington, TN 38351 and is currently estimated at $366,709, approximately $209 per square foot. 304 Locust Ln is a home located in Henderson County.
Ownership History
Date
Name
Owned For
Owner Type
Purchase Details
Closed on
Jul 14, 2020
Sold by
Brewer Linda Gardner and Bailey Cindy Gardner
Bought by
Hafer Glenda Gardner and Hafer Gary
Current Estimated Value
Home Financials for this Owner
Home Financials are based on the most recent Mortgage that was taken out on this home.
Original Mortgage
$150,000
Outstanding Balance
$78,297
Interest Rate
3.1%
Mortgage Type
Future Advance Clause Open End Mortgage
Estimated Equity
$288,412
Purchase Details
Closed on
Nov 20, 2012
Sold by
Gardner Mauree W
Bought by
Brewer Linda Gardner and Hafer Glenda Gardner
Purchase Details
Closed on
May 26, 2009
Sold by
Brewer Linda G
Bought by
Gardner John H
Purchase Details
Closed on
Jun 8, 2000
Sold by
Gardner John H
Bought by
Brewer Linda G
Purchase Details
Closed on
Jun 6, 1997
Sold by
Brewer Charles A
Bought by
Gardner John H
Purchase Details
Closed on
Sep 10, 1996
Sold by
Herman Davis James
Bought by
Brewer Charles L and Brewer Wife
Purchase Details
Closed on
May 7, 1977
Bought by
Davis James Herman and Viola Ruth
Create a Home Valuation Report for This Property
The Home Valuation Report is an in-depth analysis detailing your home's value as well as a comparison with similar homes in the area
Home Values in the Area
Average Home Value in this Area
Purchase History
| Date | Buyer | Sale Price | Title Company |
|---|---|---|---|
| Hafer Glenda Gardner | $150,000 | None Available | |
| Brewer Linda Gardner | -- | -- | |
| Gardner John H | -- | -- | |
| Brewer Linda G | -- | -- | |
| Gardner John H | $7,500 | -- | |
| Brewer Charles L | $7,500 | -- | |
| Davis James Herman | -- | -- |
Source: Public Records
Mortgage History
| Date | Status | Borrower | Loan Amount |
|---|---|---|---|
| Open | Hafer Glenda Gardner | $150,000 |
Source: Public Records
Tax History Compared to Growth
Tax History
| Year | Tax Paid | Tax Assessment Tax Assessment Total Assessment is a certain percentage of the fair market value that is determined by local assessors to be the total taxable value of land and additions on the property. | Land | Improvement |
|---|---|---|---|---|
| 2024 | $1,483 | $93,800 | $12,500 | $81,300 |
| 2023 | $1,483 | $93,800 | $12,500 | $81,300 |
| 2022 | $1,464 | $61,775 | $12,500 | $49,275 |
| 2021 | $1,464 | $61,775 | $12,500 | $49,275 |
| 2020 | $1,464 | $61,775 | $12,500 | $49,275 |
| 2019 | $1,464 | $61,775 | $12,500 | $49,275 |
| 2018 | $1,410 | $61,775 | $12,500 | $49,275 |
| 2017 | $1,410 | $61,775 | $12,500 | $49,275 |
| 2016 | $1,376 | $57,925 | $12,500 | $45,425 |
| 2015 | $1,176 | $49,500 | $12,500 | $37,000 |
| 2014 | $1,176 | $49,507 | $0 | $0 |
Source: Public Records
Map
Nearby Homes
- 0 Hickory Ln
- 0 Mount Zion Cemetery Rd Unit RTC2995294
- 0 Mount Zion Cemetery Rd Unit 10205808
- 0 Mount Zion Cemetery Rd Unit 2504381
- 68 Beecham Ln
- 105 Center Hill-Wright Rd
- 105 Center Hill Wright Rd
- 0 Guy Hart Rd
- 7022 Tennessee 22
- 205 Horseshoe Hollow Ln
- 1415 Tennessee 22
- 7420 Highway 22 S
- 7925 Highway 22 S
- 0 Cider Way
- 000 Jones Rd
- 00 Cider Way
- 000 Moonshine Rd
- 0 Moonshine Loop
- 00 Moonshine Loop
- 000 Moonshine Loop