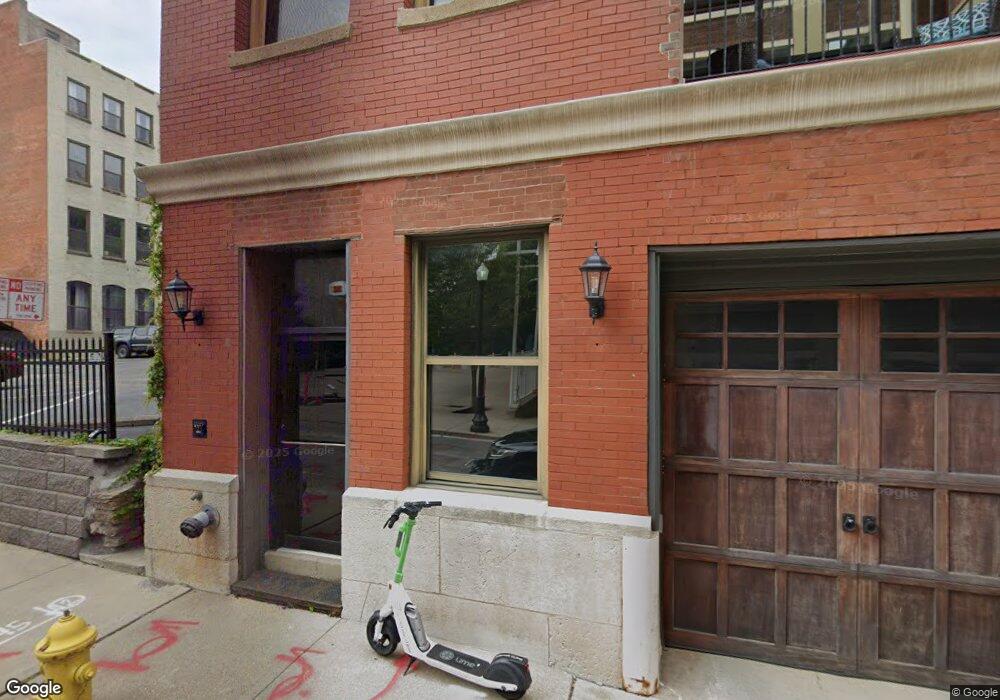
304 Mcfarland St Unit 2 Cincinnati, OH 45202
City Center NeighborhoodEstimated Value: $287,469 - $318,000
2
Beds
2
Baths
908
Sq Ft
$333/Sq Ft
Est. Value
About This Home
This home is located at 304 Mcfarland St Unit 2, Cincinnati, OH 45202 and is currently estimated at $302,617, approximately $333 per square foot. 304 Mcfarland St Unit 2 is a home located in Hamilton County with nearby schools including Hays-Porter School, Robert A. Taft Information Technology High School, and Gilbert A. Dater High School.
Ownership History
Date
Name
Owned For
Owner Type
Purchase Details
Closed on
Aug 1, 2024
Sold by
Frey Garrett W
Bought by
Black Victoria Ann
Current Estimated Value
Home Financials for this Owner
Home Financials are based on the most recent Mortgage that was taken out on this home.
Original Mortgage
$281,203
Outstanding Balance
$278,015
Interest Rate
6.86%
Mortgage Type
New Conventional
Estimated Equity
$24,602
Purchase Details
Closed on
Sep 7, 2018
Sold by
Hollstegge Allison R
Bought by
Frey Garrett W
Home Financials for this Owner
Home Financials are based on the most recent Mortgage that was taken out on this home.
Original Mortgage
$250,750
Interest Rate
4.6%
Mortgage Type
New Conventional
Purchase Details
Closed on
Feb 10, 2016
Sold by
Schwartz Jamie E
Bought by
Hollstegge Allison
Home Financials for this Owner
Home Financials are based on the most recent Mortgage that was taken out on this home.
Interest Rate
3.72%
Create a Home Valuation Report for This Property
The Home Valuation Report is an in-depth analysis detailing your home's value as well as a comparison with similar homes in the area
Home Values in the Area
Average Home Value in this Area
Purchase History
| Date | Buyer | Sale Price | Title Company |
|---|---|---|---|
| Black Victoria Ann | $289,900 | None Listed On Document | |
| Black Victoria Ann | $289,900 | None Listed On Document | |
| Frey Garrett W | $264,000 | Northwest Title Family Of Co | |
| Hollstegge Allison | $250,000 | -- |
Source: Public Records
Mortgage History
| Date | Status | Borrower | Loan Amount |
|---|---|---|---|
| Open | Black Victoria Ann | $281,203 | |
| Closed | Black Victoria Ann | $281,203 | |
| Previous Owner | Frey Garrett W | $250,750 | |
| Previous Owner | Hollstegge Allison | -- |
Source: Public Records
Tax History Compared to Growth
Tax History
| Year | Tax Paid | Tax Assessment Tax Assessment Total Assessment is a certain percentage of the fair market value that is determined by local assessors to be the total taxable value of land and additions on the property. | Land | Improvement |
|---|---|---|---|---|
| 2024 | $5,948 | $95,750 | $14,000 | $81,750 |
| 2023 | $6,077 | $95,750 | $14,000 | $81,750 |
| 2022 | $6,506 | $92,400 | $12,495 | $79,905 |
| 2021 | $1,775 | $92,400 | $12,495 | $79,905 |
| 2020 | $1,792 | $92,400 | $12,495 | $79,905 |
| 2019 | $1,668 | $87,500 | $11,900 | $75,600 |
| 2018 | $1,657 | $87,500 | $11,900 | $75,600 |
| 2017 | $1,584 | $87,500 | $11,900 | $75,600 |
| 2016 | $1,476 | $69,650 | $11,900 | $57,750 |
| 2015 | $1,336 | $69,650 | $11,900 | $57,750 |
| 2014 | $1,343 | $69,650 | $11,900 | $57,750 |
| 2013 | $1,366 | $69,650 | $11,900 | $57,750 |
Source: Public Records
Map
Nearby Homes
- 304 Mcfarland St
- 304 Mcfarland St
- 304 Mcfarland St
- 304 Mcfarland St
- 304 Mcfarland St
- 304 Mcfarland St
- 304 Mcfarland St
- 304 Mcfarland St
- 304 Mcfarland St Unit 4A
- 304 Mcfarland St Unit 3A
- 304 Mcfarland St Unit 2B
- 304 Mcfarland St Unit 2A
- 304 Mcfarland St Unit 5A
- 304 Mcfarland St Unit 1
- 304 Mcfarland St Unit 7
- 304 Mcfarland St Unit 4
- 304 Mcfarland St Unit 5
- 304 Mcfarland St Unit 3
- 304 Mcfarland St Unit 6
- 311 W 4th St