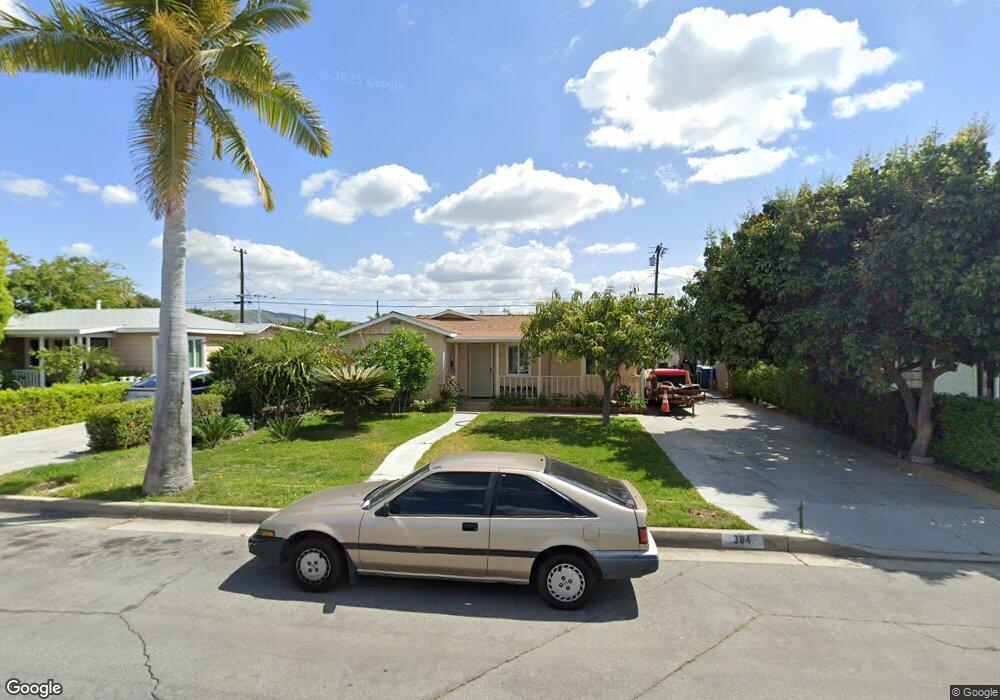
304 N College St La Habra, CA 90631
Estimated Value: $762,000 - $845,000
3
Beds
2
Baths
1,248
Sq Ft
$638/Sq Ft
Est. Value
About This Home
This home is located at 304 N College St, La Habra, CA 90631 and is currently estimated at $796,503, approximately $638 per square foot. 304 N College St is a home with nearby schools including Arbolita Elementary School, El Cerrito Elementary School, and Washington Middle School.
Ownership History
Date
Name
Owned For
Owner Type
Purchase Details
Closed on
Mar 8, 2002
Sold by
Hud
Bought by
Liang Minbo
Current Estimated Value
Home Financials for this Owner
Home Financials are based on the most recent Mortgage that was taken out on this home.
Original Mortgage
$176,080
Outstanding Balance
$72,569
Interest Rate
6.87%
Estimated Equity
$723,934
Purchase Details
Closed on
Nov 28, 2001
Sold by
Fifth Third Investment Co
Bought by
Hud
Purchase Details
Closed on
Jun 4, 2001
Sold by
Alvarado Arturo and Gamez Rebeca
Bought by
Old Kent Mtg Company
Purchase Details
Closed on
Sep 29, 1999
Sold by
Chase Bank Of Texas Na
Bought by
Alvarado Arturo and Gamez Rebeca
Home Financials for this Owner
Home Financials are based on the most recent Mortgage that was taken out on this home.
Original Mortgage
$160,427
Interest Rate
7.76%
Mortgage Type
FHA
Purchase Details
Closed on
May 14, 1999
Sold by
Jose Gamez and Jose Hien
Bought by
Chase Bank Of Texas National Assn and Texas Commerce Bank Na
Create a Home Valuation Report for This Property
The Home Valuation Report is an in-depth analysis detailing your home's value as well as a comparison with similar homes in the area
Home Values in the Area
Average Home Value in this Area
Purchase History
| Date | Buyer | Sale Price | Title Company |
|---|---|---|---|
| Liang Minbo | $220,500 | First American Title Co | |
| Hud | -- | -- | |
| Old Kent Mtg Company | $171,694 | -- | |
| Alvarado Arturo | $161,500 | Stewart Title | |
| Chase Bank Of Texas National Assn | $134,000 | American Title Ins Co |
Source: Public Records
Mortgage History
| Date | Status | Borrower | Loan Amount |
|---|---|---|---|
| Open | Liang Minbo | $176,080 | |
| Previous Owner | Alvarado Arturo | $160,427 |
Source: Public Records
Tax History Compared to Growth
Tax History
| Year | Tax Paid | Tax Assessment Tax Assessment Total Assessment is a certain percentage of the fair market value that is determined by local assessors to be the total taxable value of land and additions on the property. | Land | Improvement |
|---|---|---|---|---|
| 2025 | $3,779 | $325,142 | $250,190 | $74,952 |
| 2024 | $3,779 | $318,767 | $245,284 | $73,483 |
| 2023 | $3,689 | $312,517 | $240,474 | $72,043 |
| 2022 | $3,648 | $306,390 | $235,759 | $70,631 |
| 2021 | $3,587 | $300,383 | $231,136 | $69,247 |
| 2020 | $3,553 | $297,303 | $228,766 | $68,537 |
| 2019 | $3,456 | $291,474 | $224,280 | $67,194 |
| 2018 | $3,398 | $285,759 | $219,882 | $65,877 |
| 2017 | $3,336 | $280,156 | $215,570 | $64,586 |
| 2016 | $3,257 | $274,663 | $211,343 | $63,320 |
| 2015 | $3,164 | $270,538 | $208,169 | $62,369 |
| 2014 | $3,070 | $265,239 | $204,091 | $61,148 |
Source: Public Records
Map
Nearby Homes
- 994 E La Habra Blvd Unit 246
- 1018 E La Habra Blvd Unit 238
- 308 S Valencia St
- 570 E 2nd Ave
- 1400 Eastpark Dr
- 410 N Fonda St
- Plan 4 - The Sage at The Birchwoods
- Plan 2 - The Poppy at The Birchwoods
- 760 N Orange St
- 762 N Orange St
- 764 N Orange St
- 766 N Orange St
- 770 N Orange St
- 224 S Fonda St
- 303 S Cadiz Ct
- 1936 Skywood St
- 313 W 1st Ave Unit M
- 621 S Olive Ave
- 1241 Arbolita Dr
- 1100 N Euclid St
- 308 N College St
- 300 N College St
- 312 N College St
- 305 N Valencia St
- 309 N Valencia St
- 301 N Valencia St
- 313 N Valencia St
- 316 N College St
- 721 E Stearns Ave
- 309 N College St
- 317 N Valencia St
- 806 E Stearns Ave
- 313 N College St
- 804 E Stearns Ave
- 320 N College St
- 812 E Stearns Ave
- 717 E Stearns Ave
- 814 E Stearns Ave
- 219 N College St
- 321 N Valencia St