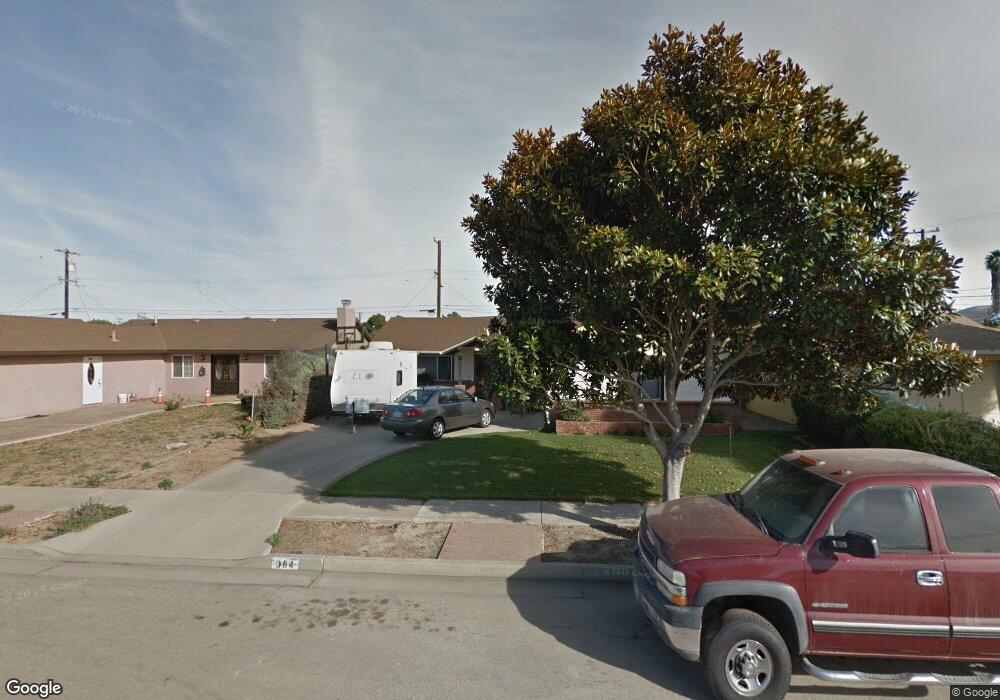
304 N X St Lompoc, CA 93436
Estimated Value: $531,839 - $564,000
3
Beds
2
Baths
1,643
Sq Ft
$332/Sq Ft
Est. Value
About This Home
This home is located at 304 N X St, Lompoc, CA 93436 and is currently estimated at $546,210, approximately $332 per square foot. 304 N X St is a home located in Santa Barbara County with nearby schools including Clarence Ruth Elementary School, Lompoc Valley Middle School, and Lompoc High School.
Ownership History
Date
Name
Owned For
Owner Type
Purchase Details
Closed on
Aug 5, 2011
Sold by
Smith Stephen Douglas
Bought by
Smith Stephen D
Current Estimated Value
Purchase Details
Closed on
Oct 27, 2008
Sold by
Smith Stephen Douglas
Bought by
Smith Stephen Douglas
Purchase Details
Closed on
Mar 15, 2003
Sold by
Smith Margaret Mary
Bought by
Smith Stephen Douglas
Create a Home Valuation Report for This Property
The Home Valuation Report is an in-depth analysis detailing your home's value as well as a comparison with similar homes in the area
Home Values in the Area
Average Home Value in this Area
Purchase History
| Date | Buyer | Sale Price | Title Company |
|---|---|---|---|
| Smith Stephen D | -- | None Available | |
| Smith Stephen Douglas | -- | None Available | |
| Smith Stephen Douglas | -- | -- |
Source: Public Records
Tax History
| Year | Tax Paid | Tax Assessment Tax Assessment Total Assessment is a certain percentage of the fair market value that is determined by local assessors to be the total taxable value of land and additions on the property. | Land | Improvement |
|---|---|---|---|---|
| 2025 | $2,921 | $273,383 | $90,166 | $183,217 |
| 2023 | $2,921 | $262,769 | $86,666 | $176,103 |
| 2022 | $2,867 | $257,617 | $84,967 | $172,650 |
| 2021 | $2,897 | $252,566 | $83,301 | $169,265 |
| 2020 | $2,865 | $249,977 | $82,447 | $167,530 |
| 2019 | $2,816 | $245,077 | $80,831 | $164,246 |
| 2018 | $2,771 | $240,273 | $79,247 | $161,026 |
| 2017 | $2,719 | $235,563 | $77,694 | $157,869 |
| 2016 | $2,669 | $230,945 | $76,171 | $154,774 |
| 2014 | $2,609 | $223,022 | $73,558 | $149,464 |
Source: Public Records
Map
Nearby Homes
- 321 N Z St
- 420 N W St
- 112 N X St
- 1408 W Walnut Ave
- 1410 W Apricot Ave
- 516 N U St
- 600 N Y St
- 267 Village Circle Dr
- 23 Village Circle Dr
- 230 N R St
- 1011 W Walnut Ave
- 1311 W Cypress Ave Unit B2
- 400 Coronado Dr
- 217 N M St
- 4314 W Ocean Ave
- 524 Avalon St
- 413 S O Place
- 1328 W Willow Ave
- 526 N L St
- 1103 Point Sal Loop
Your Personal Tour Guide
Ask me questions while you tour the home.