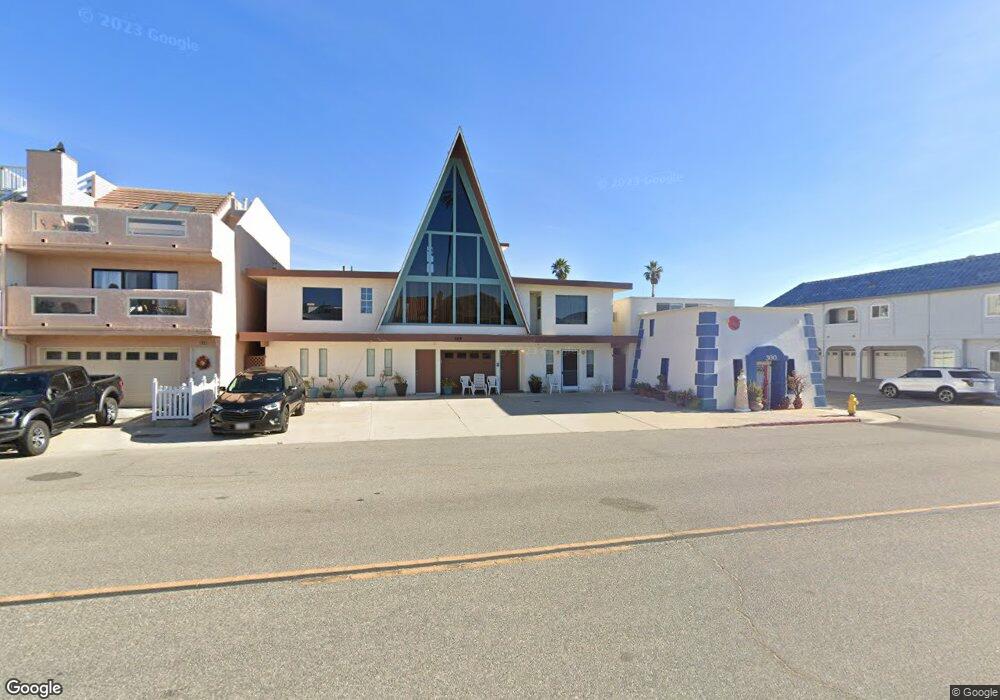
304 Ocean Dr Unit 3 Oxnard, CA 93035
Silver Strand NeighborhoodEstimated Value: $1,845,690
4
Beds
4
Baths
3,500
Sq Ft
$527/Sq Ft
Est. Value
About This Home
This home is located at 304 Ocean Dr Unit 3, Oxnard, CA 93035 and is currently estimated at $1,845,690, approximately $527 per square foot. 304 Ocean Dr Unit 3 is a home located in Ventura County with nearby schools including Hollywood Beach Elementary School and Oxnard High School.
Ownership History
Date
Name
Owned For
Owner Type
Purchase Details
Closed on
Feb 21, 2018
Sold by
Sisson Tryon N and Sisson Dolores A
Bought by
C N W Pa
Current Estimated Value
Purchase Details
Closed on
Nov 19, 2009
Sold by
Sisson Tryon N and Sisson Dolores A
Bought by
Sisson Tryon N and Sisson Dolores A
Purchase Details
Closed on
Aug 22, 2006
Sold by
Luczak Donald J and Desario Jeanne A M
Bought by
Sisson Tryon N and Sisson Dolores A
Purchase Details
Closed on
Feb 16, 2005
Sold by
Luczak Rosemary
Bought by
Luczak Donald J and Desario Jeanne A M
Purchase Details
Closed on
Jul 8, 1998
Sold by
Burstein Mel
Bought by
Luczak Rosemary C
Purchase Details
Closed on
Jul 8, 1997
Sold by
Snider Benjamin
Bought by
Burstein Mel B and Ocean Drive Trust
Purchase Details
Closed on
Jan 27, 1997
Sold by
Ryan Keiron J and Ryan Georgine P
Bought by
Ocean Drive Trust
Create a Home Valuation Report for This Property
The Home Valuation Report is an in-depth analysis detailing your home's value as well as a comparison with similar homes in the area
Home Values in the Area
Average Home Value in this Area
Purchase History
| Date | Buyer | Sale Price | Title Company |
|---|---|---|---|
| C N W Pa | $1,265,000 | Esquire Title Co | |
| Sisson Tryon N | -- | None Available | |
| Sisson Tryon N | $1,050,000 | Equity Title Company | |
| Luczak Donald J | $430,000 | -- | |
| Luczak Rosemary C | $425,000 | Benefit Land Title Company | |
| Burstein Mel B | -- | Benefit Land Title Company | |
| Ocean Drive Trust | $219,440 | Stewart Title |
Source: Public Records
Tax History
| Year | Tax Paid | Tax Assessment Tax Assessment Total Assessment is a certain percentage of the fair market value that is determined by local assessors to be the total taxable value of land and additions on the property. | Land | Improvement |
|---|---|---|---|---|
| 2025 | $16,885 | $1,439,350 | $955,776 | $483,574 |
| 2024 | $16,885 | $1,411,128 | $937,035 | $474,093 |
| 2023 | $16,039 | $1,383,459 | $918,661 | $464,798 |
| 2022 | $15,591 | $1,356,333 | $900,648 | $455,685 |
| 2021 | $15,585 | $1,329,739 | $882,989 | $446,750 |
| 2020 | $15,401 | $1,316,106 | $873,936 | $442,170 |
| 2019 | $15,184 | $1,290,300 | $856,800 | $433,500 |
| 2018 | $14,344 | $1,236,365 | $470,995 | $765,370 |
| 2017 | $5,718 | $500,000 | $190,000 | $310,000 |
| 2016 | $6,387 | $565,000 | $215,000 | $350,000 |
| 2015 | $7,984 | $714,000 | $272,000 | $442,000 |
| 2014 | $8,057 | $714,000 | $270,000 | $444,000 |
Source: Public Records
Map
Nearby Homes
- 137 Santa Monica Ave
- 141 Los Angeles Ave
- 145 Los Angeles Ave
- 133 Santa Paula Ave
- 137 Fillmore Ave
- 120 Hueneme Ave
- 1825 Ocean Dr
- 117 Tujunga Ave
- 292 Highland Dr
- 2125 Piru Ave
- 360 Melrose Dr
- 105 Malibu Ave
- 316 Santa Monica Dr
- 2408 Ocean Dr
- 2516 Roosevelt Blvd
- 2421 Ocean Dr
- 2525 Roosevelt Blvd
- 274 Sunset
- 2916 Lakeshore Ct
- 124 San Clemente Ave
- 304 Ocean Dr
- 316 Ocean Dr
- 300 Ocean Dr
- 320 Ocean Dr
- 109 Los Angeles Ave
- 512 Ocean Dr
- 113 Los Angeles Ave
- 220 Ocean Dr
- 112 Camarillo Ave
- 106 Los Angeles Ave
- 117 Los Angeles Ave
- 116 Camarillo Ave
- 108 Los Angeles Ave Unit 106
- 108 Los Angeles Ave
- 216 Ocean Dr
- 400 Ocean Dr
- 112 Los Angeles Ave
- 309 Ocean Dr
- 212 Ocean Dr
- 317 Ocean Dr Unit 2
Your Personal Tour Guide
Ask me questions while you tour the home.